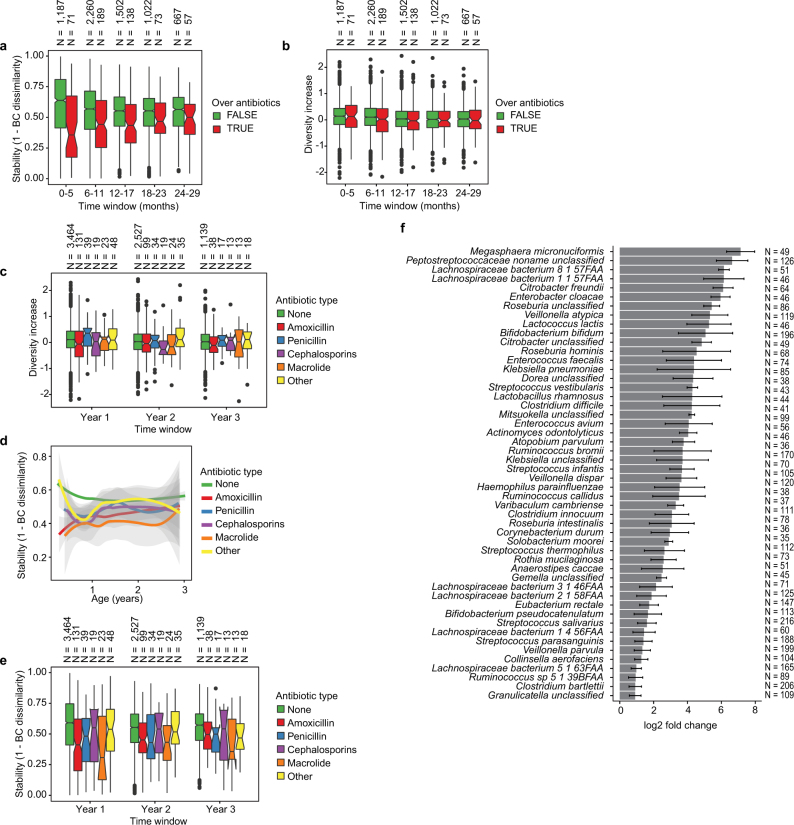
Extended Data Fig. 4. Effects of antibiotics.
a, Influence of antibiotic courses on microbial stability, stratified into six-month time windows (x axis). Stability was measured by Bray–Curtis dissimilarity over consecutive stool samples (<50 days apart) from the same individual between 3 and 29 months of age, and stratified by whether antibiotics were given between the two samples. For each notched box plot, the box denote the interquartile range (IQR), the horizontal line denotes the median, and the notch denotes the approximation for the 95% confidence interval (notch width = 1.58 × IQR/n0.5, in which n is the number of samples per box plot). Compare to Fig. 2c. b, Influence of antibiotic courses on microbial diversity. Notched box plots denote the increase (difference) in diversity between two consecutive stool samples (<50 days apart) stratified by antibiotic administration between the samples. Data show no difference between the groups (antibiotics versus no antibiotics). c, Influence of antibiotics courses on microbial diversity by antibiotic type; data from b stratified into one-year time windows (x axis) and antibiotic types. No significant differences were detected between the antibiotic types. d, e, Influence of antibiotic courses on microbial stability by antibiotic type; data from Fig. 2c and Extended Data Fig. 3a stratified by antibiotic type. d, LOESS fit for the relative abundances (shaded area shows 95% confidence interval for each fit, as implemented in geom_smooth function in ggplot2 R package). e, Notched box plots (as in a and b) for the data per antibiotic type. No significant differences were detected between the antibiotic types. No antibiotics, n = 7,130; amoxicillin, n = 268; penicillin, n = 90; cephalosporin, n = 51; macrolide, n = 60; other, n = 101. f, Decreases in relative abundance of bacteria over antibiotic courses. Bacteria for which the bootstrapped 95% confidence interval of the fold change does not overlap zero are shown. Fold change was measured between consecutive samples with an antibiotic course between them, given that the species in question was present in the first of the two samples. Sample size per species (n) indicate the number of sample pairs in which the species in question was present in the sample preceding the antibiotic treatment. Bars denote bootstrapped mean log2(fold change) (that is, decrease), and error bars denote s.d. (n = 1,000 bootstrap samples).

