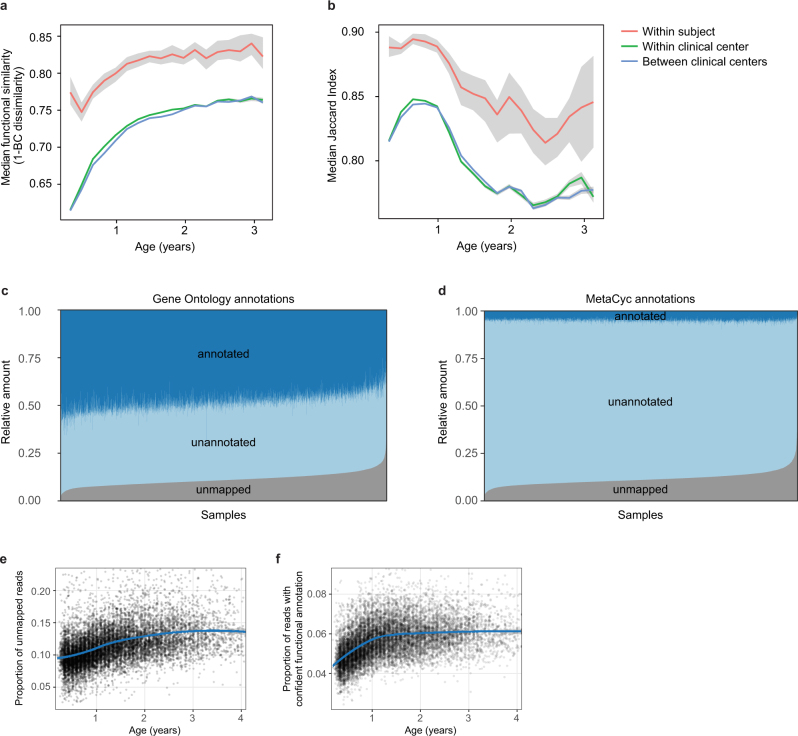
Extended Data Fig. 5. Dynamics of species-specific microbial functional potential during early gut development.
a, b, Stability of microbial pathways (n = 10,580 samples) measured by Bray–Curtis dissimilarity (a) and the Jaccard index (b) and stratified into three groups: within subject, within clinical centre, and across clinical centres. Although the baseline level of functional similarity is significantly greater than that of taxa (see Fig. 2b), functional states and development trajectories also both retain a level of personalization. The stability of the functional profiles was evaluated in three-month time windows, over two-month increments. Lines show the median per time window, and shaded area denotes the 99% confidence interval estimated using binomial distribution. c, d, Proportion of metagenomic gene abundance with functional annotation through Gene Ontology (c) and MetaCyc (d) databases. The metagenomic reads were divided into the following categories: reads that could be mapped to genes with functional assignment in the database in question (annotated), and reads with no annotation but alignment to species pangenomes or UniProt proteins (unannotated). The proportion of the unknown genes (unmapped) was estimated using the number of reads with unknown origin. e, The proportion of unmapped reads, reflecting the relative abundances of reads not mappable to any microbial pangenomes in the available reference set or to UniProt. An increasing trend of unmapped reads with respect to the age at sample collection continued through approximately two years of age. f, The proportion of reads with confident functional annotation in MetaCyc within the genes that mapped to species pangenomes or UniProt proteins. The data again showed an increasing longitudinal trend, implicating a deficit of functional and biochemical annotations within microorganisms that are abundant during the first year of life.

