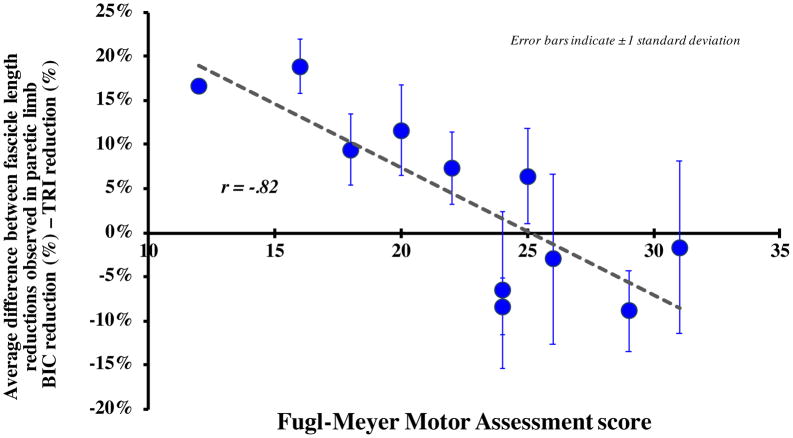
Figure 4.
The average difference between the fascicle length % reductions observed in the paretic limb for the biceps and the triceps (average % biceps reduction – average % triceps reduction) in each subject plotted as a function of Fugl-Meyer Assessment score, a clinical assessment of impairment level. Each data point indicates the average difference between the biceps and triceps paretic limb reduction for each individual subject, observed under passive conditions across the three tested elbow positions; error bars indicate ± 1 standard deviation. A positive difference indicates that there was a greater average decrease in fascicle lengths in the paretic biceps brachii than that seen in the triceps; a negative difference indicates a greater average decrease in paretic triceps brachii fascicle lengths. Pearson correlation analysis indicates a significant correlation between the difference in paretic % reduction between the two muscles and impairment level across all positions (r=−.82, p=.002).

