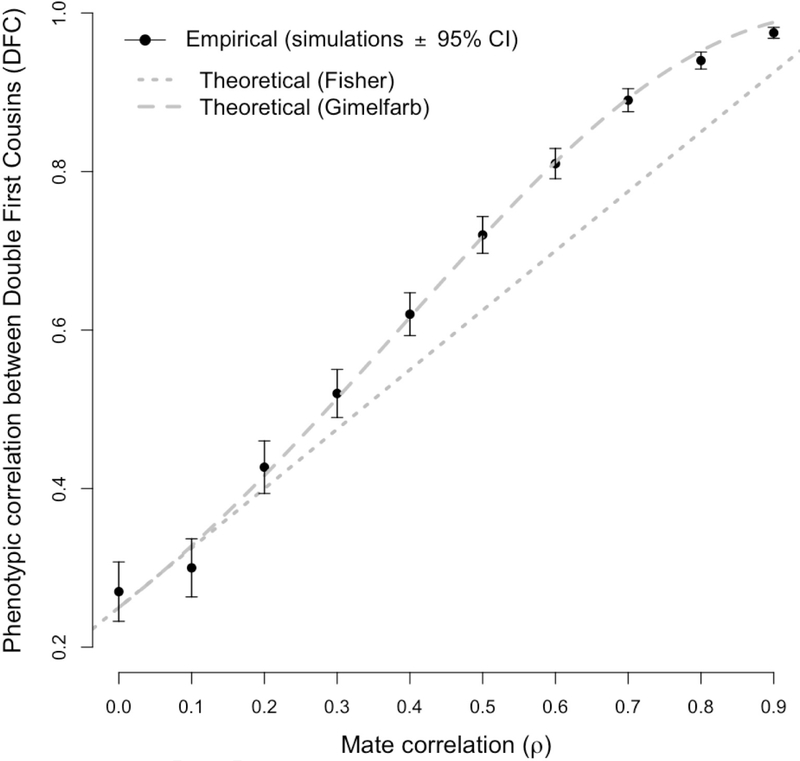
Figure 4:
Phenotypic correlation of simulated double first cousins (DFC) as a function of the mate correlation ρ. Each simulation replicate (black dot) corresponds to a simulated population of 1,000 males and 1,000 females undergoing AM for 10,000 generations with a given value of ρ. The heritability is fixed in this simulation to h2 = 1. For each value of ρ, the empirical correlation between DFC was calculated across the 10,000 generations and compared to theoretical expectations from Fisher (1918) (equation 16) and Gimelfarb (1981a) (equation 17). CI stands for Confidence Interval.

