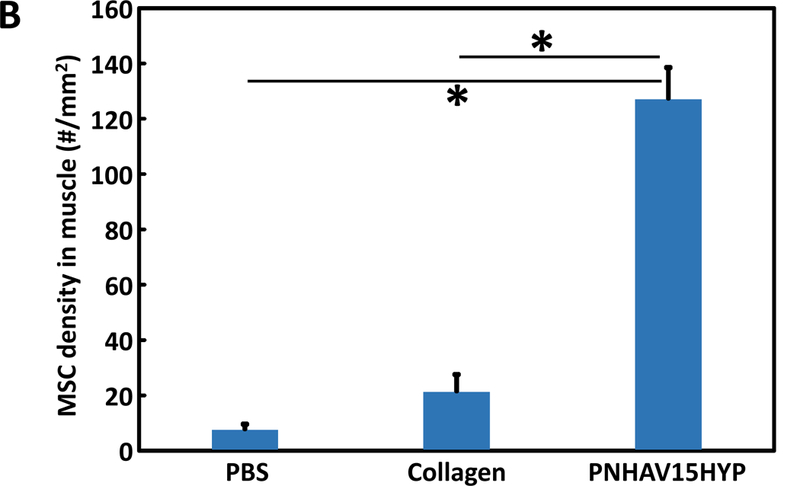
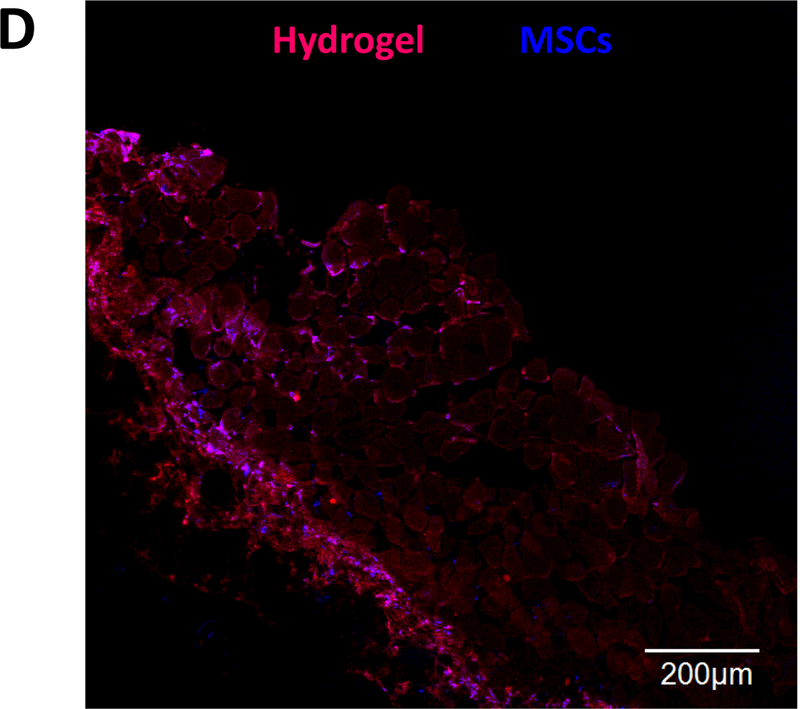
Figure 8.


MSC retention in thigh muscles of C57BL/6 mice. MSCs were labeled by live cell tracker CMDil. (A) Live MSCs in muscle tissues after 24 h of implantation. PNHAV15HYP, collagen and PBS were used as cell carriers; (B) quantification of MSC density in tissues based on the images. Scale bar = 100 μm. *p<0.01; Hydrogel fluorescent signal change and MSC survival after injection into thigh muscles of nude mice for 4 weeks. fluorescent images of hydrogel PNHAV15HYP during the 4‐week implantation period; and (D) confocal image of hydrogel and live MSCs (CMDil‐labeled) after 4 weeks of implantation. Scale bar = 100 μm. In A and D, the color for red fluorescent CMDil was changed to blue in order to clearly distinguish the CMDil‐labeled cells and hydrogel.
