FIGURE 4.

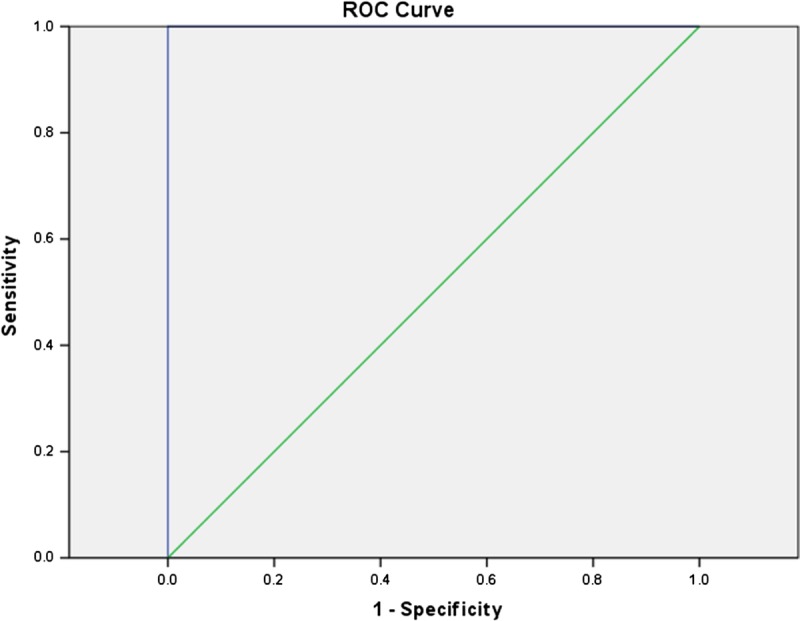
Receiver operating characteristics curve of DWI hyperintensity in 3 T; area under the ROC curve, 1. Figure 4 can be viewed online in color at www.jcat.org.

Receiver operating characteristics curve of DWI hyperintensity in 3 T; area under the ROC curve, 1. Figure 4 can be viewed online in color at www.jcat.org.