
FIGURE 6.
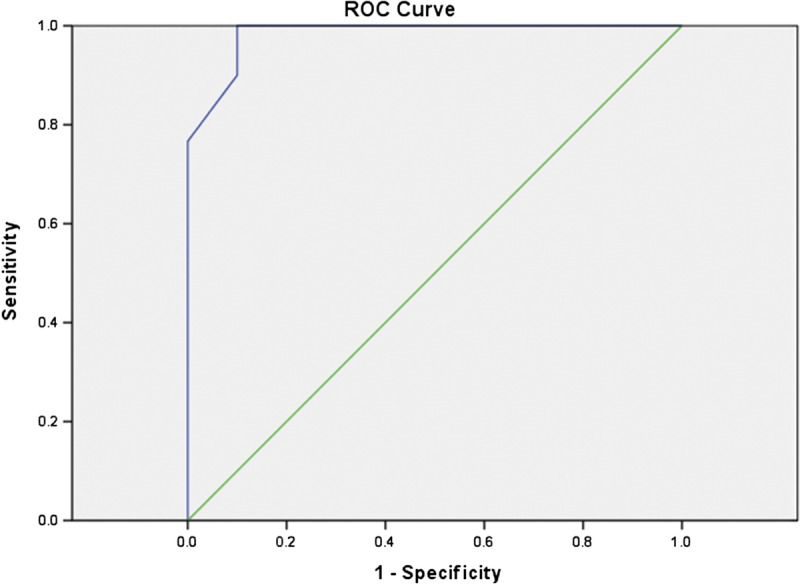
Receiver operating characteristics curve of mean ADC in 3 T; area under the ROC curve, 0.98. Figure 6 can be viewed online in color at www.jcat.org.
Official websites use .gov
A
.gov website belongs to an official
government organization in the United States.
Secure .gov websites use HTTPS
A lock (
) or https:// means you've safely
connected to the .gov website. Share sensitive
information only on official, secure websites.
Receiver operating characteristics curve of mean ADC in 3 T; area under the ROC curve, 0.98. Figure 6 can be viewed online in color at www.jcat.org.