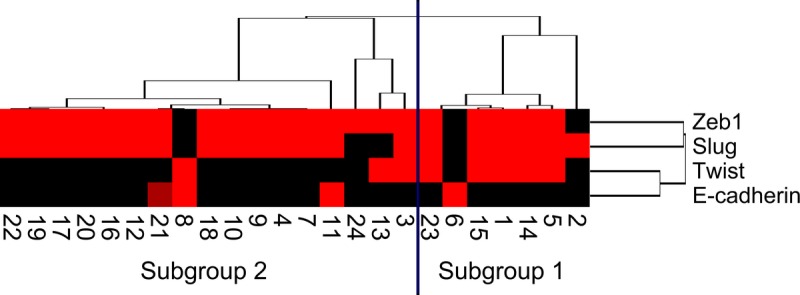
FIGURE 4.

Hierarchical cluster analysis of APCs based on the protein expression patterns of E-cadherin, Slug, Twist, and Zeb1 in the sarcomatous component. Undifferentiated carcinomas were subdivided into 2 subgroups. The vertical line shows the expression of each marker in the tumor cells of the sarcomatous component, and the horizontal lines denote “relatedness” between samples. The colors of the box express the immunoreactivity score (0–8), ranging from black (score 0) to red (score 8). Numbers indicate patient number.
