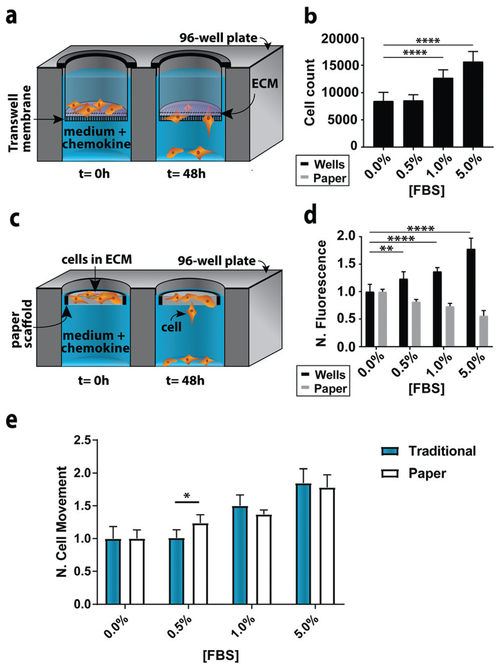
Fig. 2.
Representative monoculture assay setups. (a) Schematic of a traditional Transwell invasion assay used in this work. (b) M231 cell invasion through collagen-coated inserts after a 48 h exposure to medium containing increasing concentrations of FBS (n = 15). (c) Schematic of the paper-based assay used in this work. (d) M231 cell invasion from collagen-containing paper scaffolds after a 48 h exposure to medium containing increasing concentrations of FBS (n = 5). All signals were normalized to 0.0% FBS. Each bar represents the average and standard deviation. (e) Comparison of M231 invasion in paper-based and traditional Transwell invasion assays (n = 5). * p < 0.05, ** p < 0.01, and **** p <0.0001.

