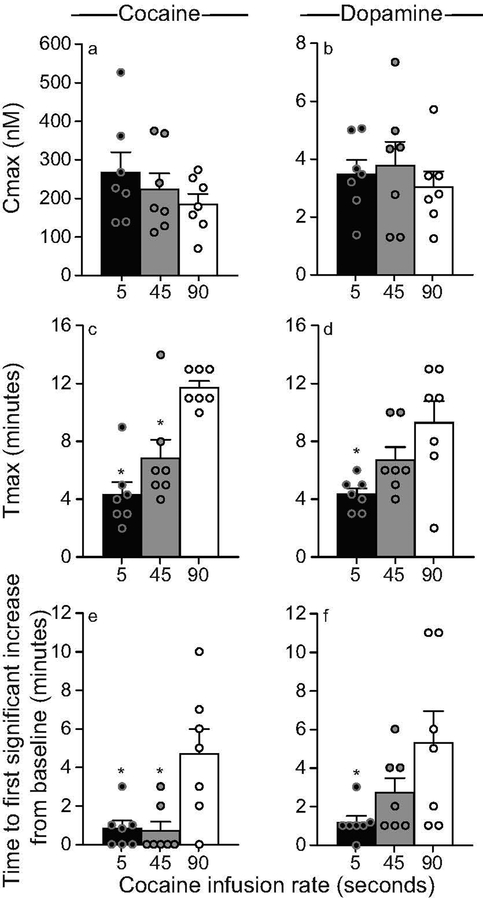
Figure 4. Varying the rate of i.v. infusion between 5–90 s influences the rate of rise of cocaine and dopamine concentrations (Tmax) in the dorsal striatum without producing large effects on maximum concentrations (Cmax).
Panels (a) and (b) show average Cmax values for cocaine and dopamine, respectively, as a function of the rate of i.v. cocaine infusion. The time to reach peak concentrations (Tmax) of cocaine (c) and dopamine (d) in the dorsal striatum is shown as a function of the rate of i.v. cocaine delivery. Panels (e) and (f) show the time interval before cocaine and dopamine concentrations were significantly greater than baseline levels (> 2 standard deviations above baseline), as a function of the rate of i.v. cocaine delivery. All values are mean ± SEM. n = 7 rats/infusion rate. *P < 0.05 compared to 90 s. nM, nanomoles/liter. s, seconds.

