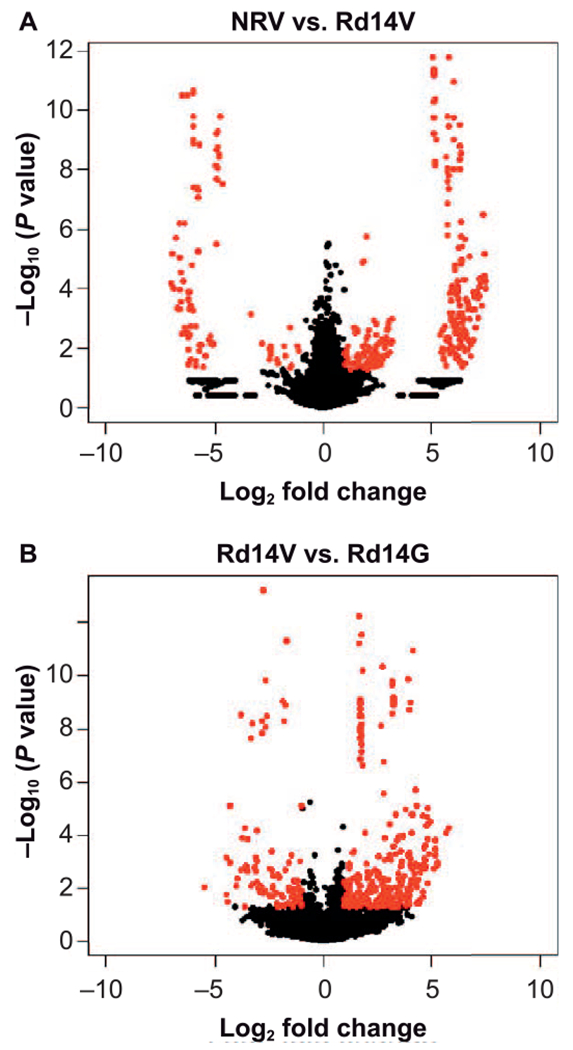
FIG. 5.

Volcano plots facilitating visualization of significantly differentiating proteins. The plot indicates both fold change expression (X-axis, log2) as well as the significance level [Y-axis, −log10 (P value)] for nonirradiated vehicle control (NRV) and irradiated mice at day 14 (Rd14V) (panel A) and irradiated vehicle (Rd14V) and irradiated mice receiving GT3 (Rd14G) (Panel B), respectively. The proteins shown in red have a relative fold change of ≥0.5 or ≤2.0 and P value ≤ 0.05 in the two comparative groups. n = 3 biological replicates.
