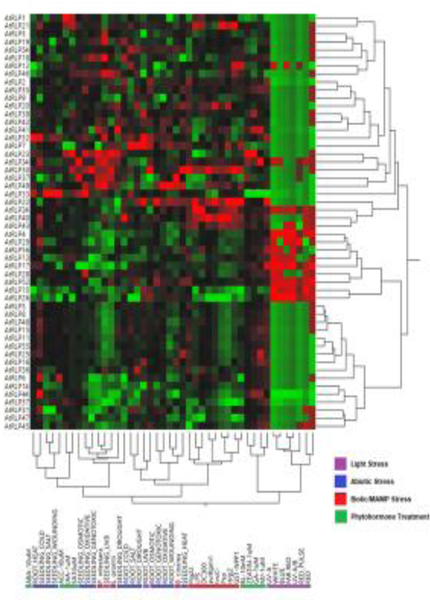
Figure 2: Expression heatmap of LRR-RLPs in A. thaliana.
RLPs (Y-axis), and treatments (X-axis) are depicted after hierarchical two-way clustering. Relative transcriptional induction (red) and suppression (green) represent visualization of fold change in expression from the global median using values acquired from the AtGenExpress Visualization Tool [104]. This heatmap was generated using the JMP statistical software.

