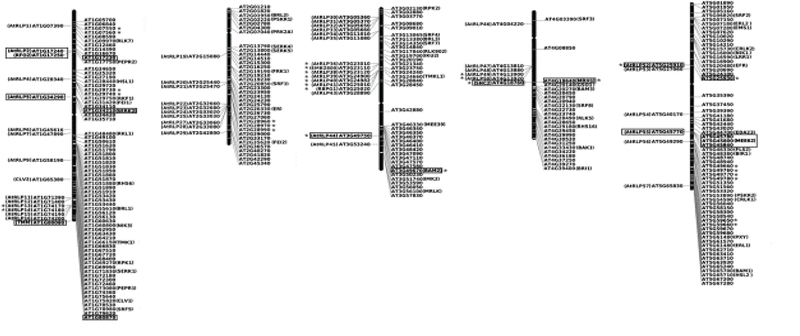
Figure 4. Physical map of A. thaliana LRR-RLPs and LRR-RLKs on chromosomes.
RLPs and RLKs (depicted on the left and right of each chromosome, respectively) were positioned using the TAIR chromosome map tool and further arranged for ease visualization. RLPs physically close to RLKs were indicated using boxes. Asterisks indicate proximal RLPs or RLKs with similar expression pattern. Physically clustered RLPs and RLKs were tested for correlations in expression using absolute expression values acquired from the Arabidopsis eFP browser (datasets “Developmental Map” and “Biotic Stress” http://bar.utoronto.ca/efp/cgi-bin/efpWeb.cgi). A Spearman’s rho value with magnitude greater than |ρ| = 0.5 with a p-value of <0.05 was used to determine positive and negative correlations.

