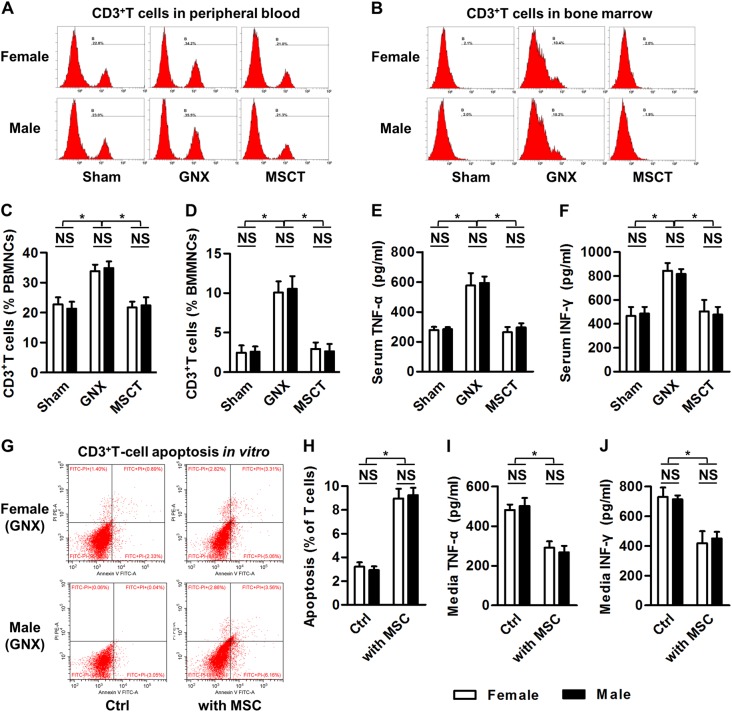
Fig. 6. Total T-cell and inflammatory cytokine responses.
a, b Flow cytometric analysis of systemic (circulation) and local (bone marrow) CD3+ T-cell populations. GNX, gonadectomy; MSCT, mesenchymal stem cell transplantation in GNX mice. (c, d) Corresponding quantification of total CD3+ T cells. PBMNCs peripheral blood mononuclear cells, BMMNCs bone marrow mononuclear cells. n = 3 per group. e, f Serological markers of inflammation. TNF-α tumor necrosis factor-alpha, IFN-γ interferon-gamma, n = 5 per group. g, h Flow cytometric analysis of the apoptotic rate of CD3+ T cells from GNX mice in co-culture with or without mesenchymal stem cells (MSCs). i, j Inflammatory cytokine concentrations in the co-culture media. n = 3 per group. The data represent the means ± SD. *P < 0.05; NS not significant (P > 0.05)

