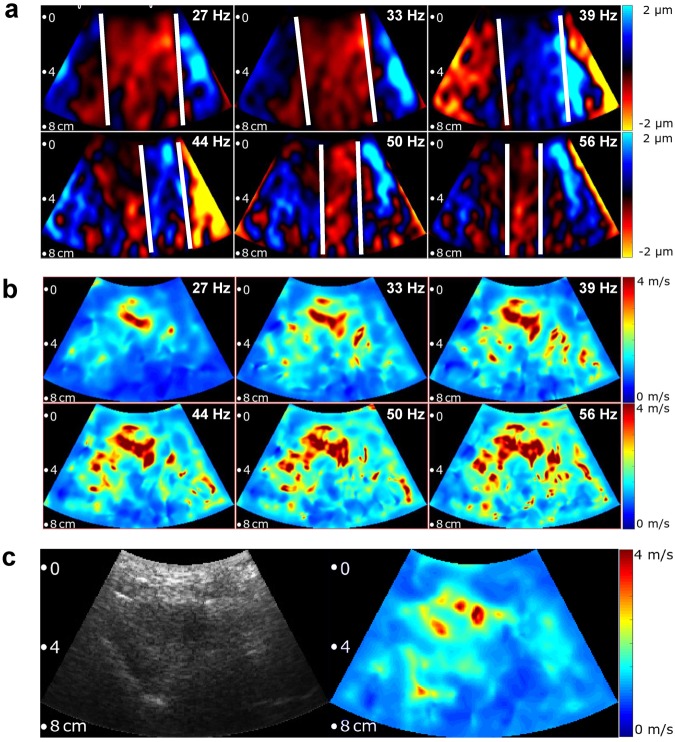
Figure 3.
Multifrequency SWS compounding. (a) Raw wave images at six excitation frequencies. White lines demarcate wave fronts to illustrate the approximate lengths of half-waves. (b) Single-frequency elastograms (SWS maps) obtained after wave-gradient based inversion44. (c) Representative B-mode image (left hand side) and final elastograms (SWS map, right hand side) which was generated from the six single-frequency SWS maps shown in (b).

