
Figure 5.
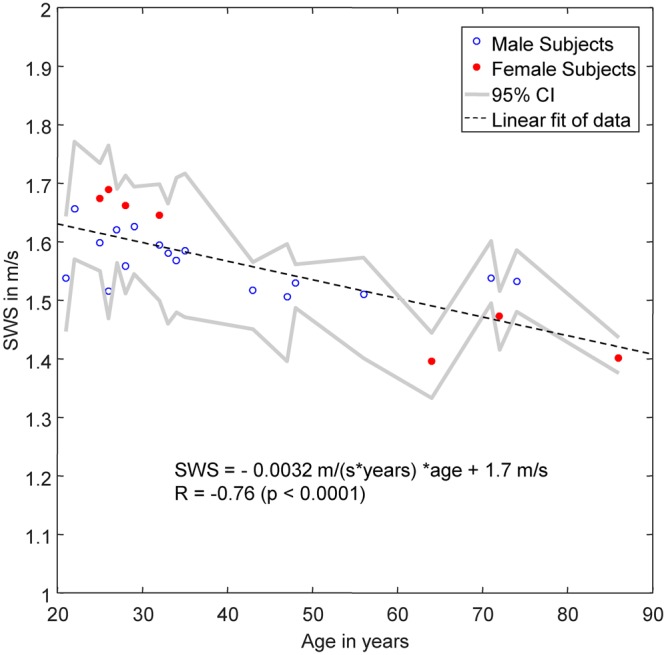
Baseline SWS in healthy subjects over years of age. Gray lines demarcate 95% confidence intervals (CI). The linear regression line (dashed line) was fitted to pooled data without consideration of sex differences.
Official websites use .gov
A
.gov website belongs to an official
government organization in the United States.
Secure .gov websites use HTTPS
A lock (
) or https:// means you've safely
connected to the .gov website. Share sensitive
information only on official, secure websites.
Baseline SWS in healthy subjects over years of age. Gray lines demarcate 95% confidence intervals (CI). The linear regression line (dashed line) was fitted to pooled data without consideration of sex differences.