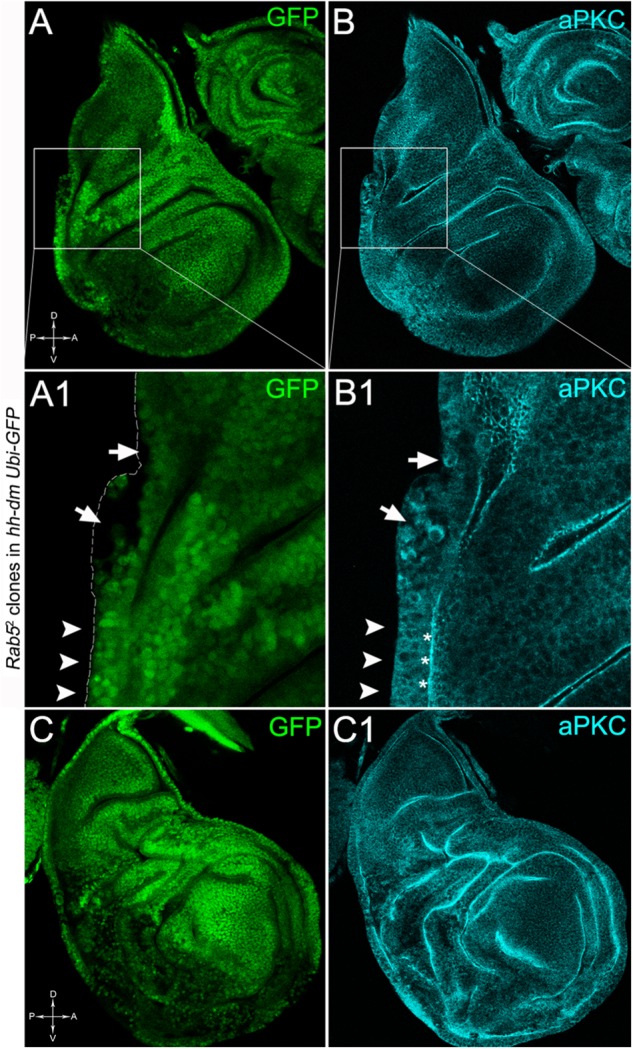
FIGURE 12.

Rab5-/- cells show loss of cell polarity in a MYC-overexpressing background. Immunostaining for aPKC (cyan) on wing discs from late w; Rab52, FRT40A/Ubi-GFPnls, FRT40A; hh-Gal4/UAS-dm larvae. In A1,B1, arrows indicate mutant cells (black) displaying membrane redistribution of the apical marker aPKC, while the arrowheads point to a normal region of the disc border where the pseudostratified epithelium shows apical aPKC staining (asterisks). The dashed line in A1 marks the disc outer border. The basic genotype is indicated on the left of the figure panel. Disc axes are indicated in A,C. A1,B1 are magnified views of the squares drawn in A,B. Magnification is 400× in A,B,C,C1 and 1000× in A1,B1.
