
FIGURE 2.
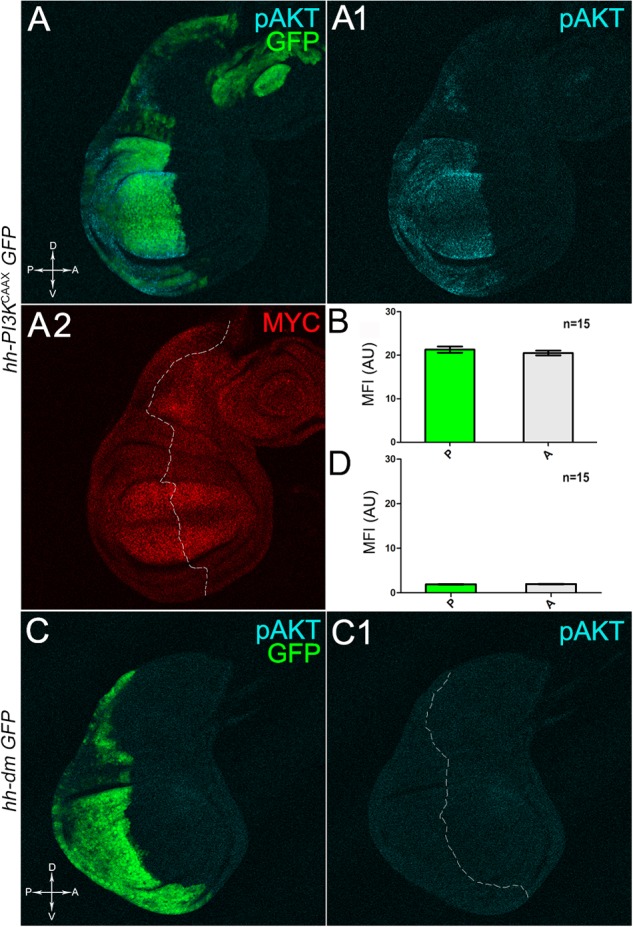
MYC and PI3KCAAX overexpression do not induce reciprocal activation. (A–A2) Immunostaining for pAKT (A,A1, cyan) and MYC (A2, red) on wing discs from late yw/yw, UAS-PI3KCAAX; hh-Gal4, UAS-GFP/+ larvae. (B) Graph comparing the Mean Fluorescence Intensity Arbitrary Units (MFI-AU) of MYC staining measured in the P (green bar) and A (grey bar) compartments of 15 wing discs from different larvae. (C,C1) Immunostaining for pAKT (cyan) on wing discs from late yw; hh-Gal4, UAS-GFP/UAS-dm larvae. (D) Graph comparing the Mean Fluorescence Intensity Arbitrary Units (MFI-AU) of pAKT staining measured in the P (green bar) and A (grey bar) compartments of 15 wing discs from different larvae. Basic genotypes are indicated on the left of the figure panel. P compartments are outlined in A2,C1, and disc axes are indicated in A,C. Magnification is 400×.