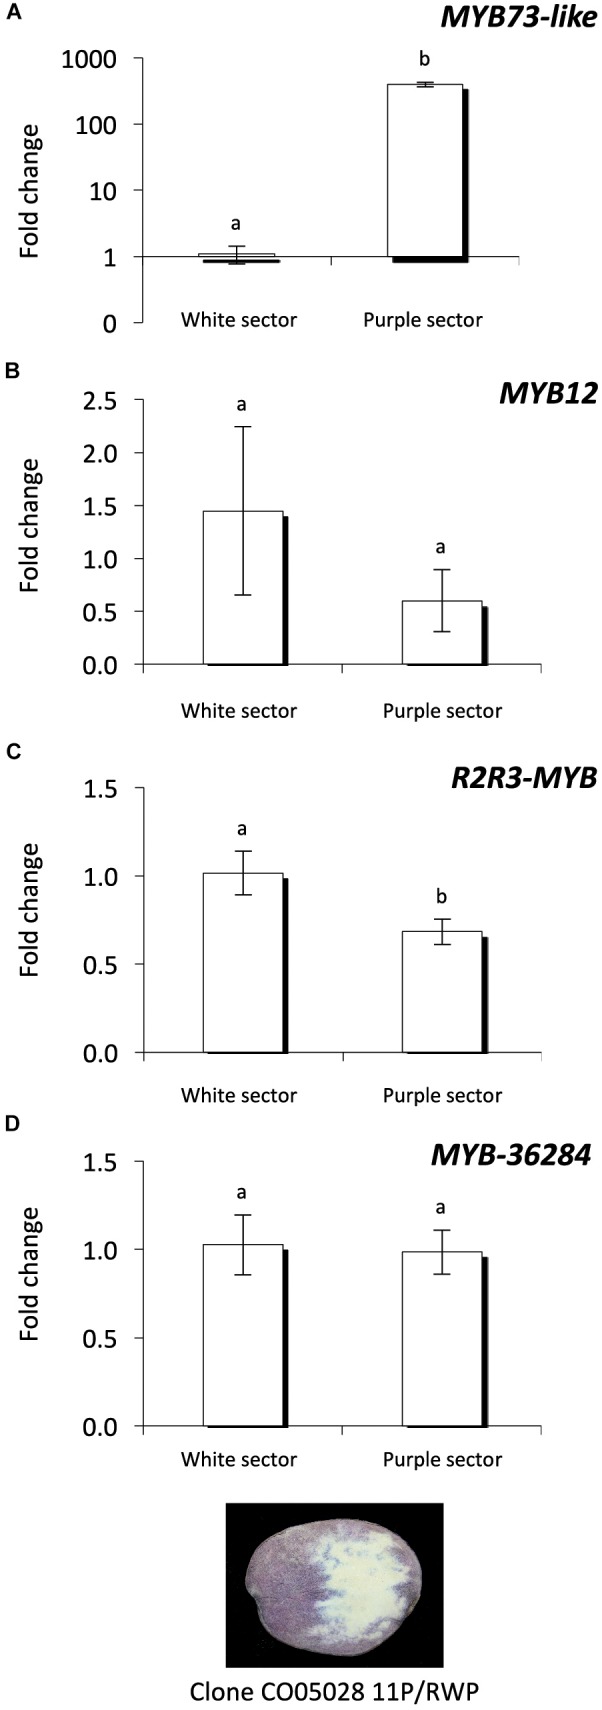
FIGURE 7.

Expression analysis of MYB genes in the same tuber. Purple and white sectors of CO05028 11P/RWP were used to analyze the expression of MYB73-like (A); MYB12 (B); R2R3-MYB (C); and MYB-36284 (D) genes in tuber flesh. Relative quantification was made to white sector samples; the letters on the bars indicate significantly different expression levels of genes using Student’s T-test (p < 0.05); different letters mean significant differences between the samples.
