FIGURE 5.
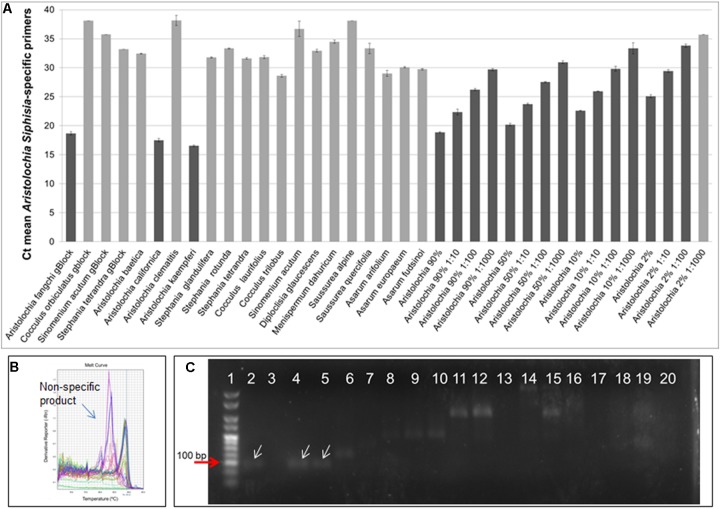
Aristolochia subgenus Siphisia-specific quantitative real-time (A) Ct values. The lighter bars indicate primer dimers or non-specific products as per melting curve data. qPCR was performed using three biological replicates with three technical replicates for each sample. Error bars represent Standard deviation. (B) Melting curve for all samples run with Siphisia-specific primers. (C) Agarose gel electrophoresis of PCRs using Siphisia-specific primers. The white arrows point to the products with the expected size (88 bp). Gel lanes: (1) HyperLadderTM 25 bp (Bioline); (2) Positive control; (3) Negative (no template) control; (4) A. californica; (5) A. kaempferi; (6) A. baetica; (7) A. clematitis; (8) S. tetrandra; (9) S. glandulifera; (10) S. rotunda; (11) C. trilobus; (12) C. laurifolius; (13) S. acutum; (14) A. europaeum; (15) A. arifolium; (16) A. fudsinoi; (17) S. alpine; (18) D. glaucescens; (19) M. dahuricum; (20) S. quercifolia.

