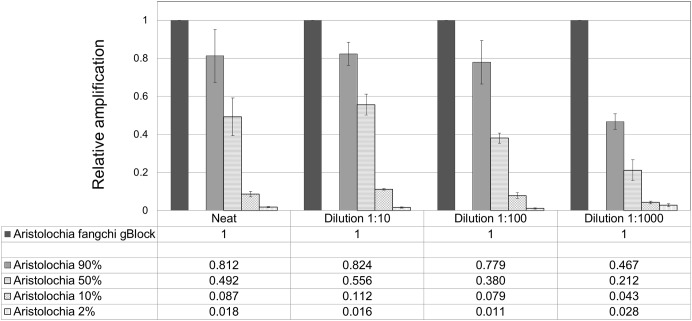
FIGURE 7.
Quantitation of Aristolochia subgenus Siphisia DNA in admixtures. ΔCt values were calculated as the difference between the mean Ct value of the target Siphisia-specific amplification and the mean Ct value of the internal control 5.8S amplification. Aristolochia S-5 gBlock neat and dilutions 1:10, 1:100, and 1:1000 were used as calibrator samples for the corresponsive dilution mix. qPCR was performed using three biological replicates with three technical replicates for each sample. Error bars represent Standard deviation.

