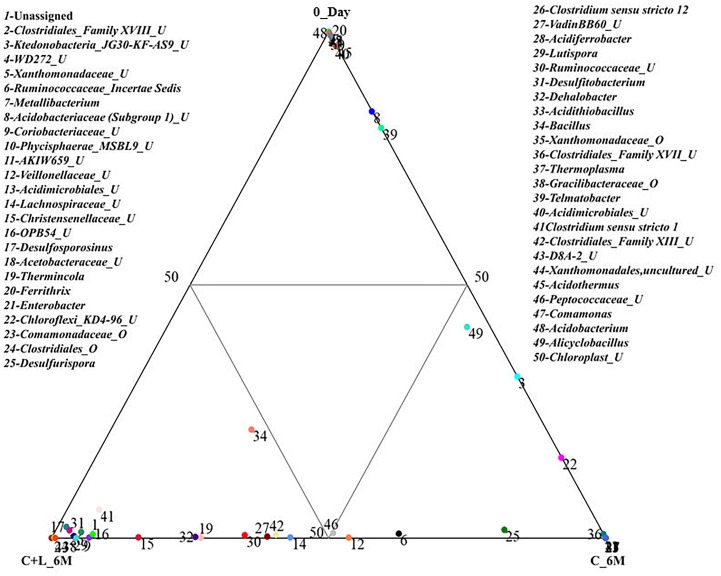
FIGURE 3.
Distribution of taxonomic groups at genera level in 0_Day, C_6M and C+L_6M. The 50 most abundant genera (cumulative abundance > 0.2%) associated with each sample is visualized in ternary plots. The position in the triangle indicates the relative abundance of each taxon among the three samples. U and O denote uncultured member and others, respectively.

