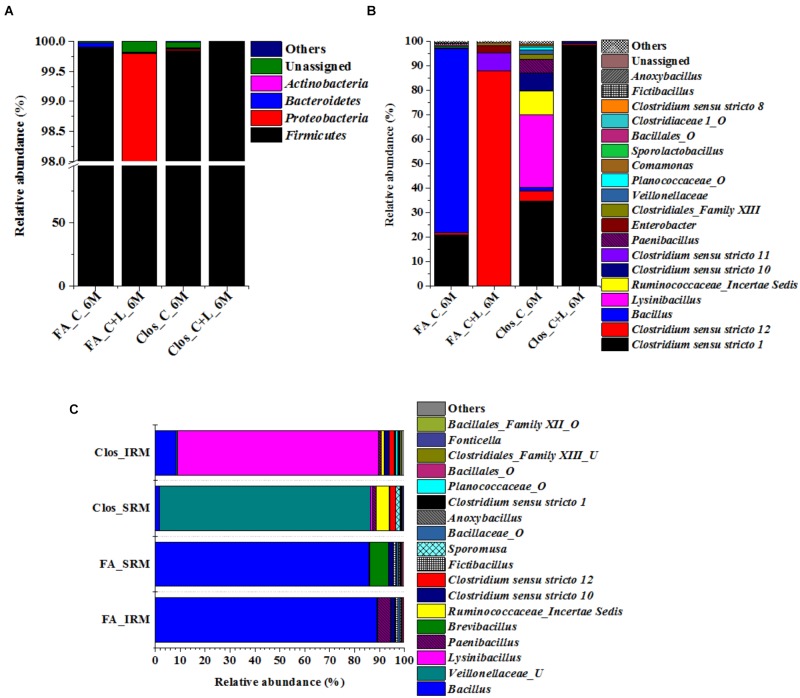
FIGURE 8.
Taxonomic distribution of enrichment setups from C_6M and C+L_6M. (A) Phylum-level distribution of enriched populations in Clostridium specific (Clos) and Facultative anaerobic (FA) enrichment. (B) Distribution of genera in Clostridium specific enrichment and Facultative anaerobic enrichment. (C) Shift in microbial diversity (represented at genera-level) when enriched population of Clos_C_6M and FA_C_6M were subjected to iron and sulfate reducing medium. Clos_IRM: distribution pattern of Clostridium specific enrichment in iron reducing medium; Clos_SRM: distribution pattern of Clostridium specific enrichment in sulfate reducing medium; FA_IRM: distribution pattern of Facultative anaerobic enrichment in iron reducing medium and FA_SRM: distribution pattern of Facultative anaerobic enrichment in iron reducing medium. U and O denote uncultured member and others, respectively.

