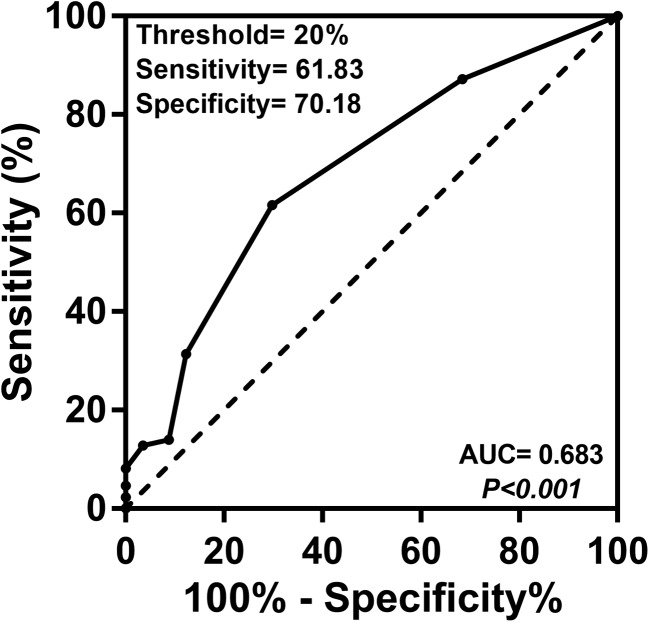
Fig. 3.
Receiver operating characteristics curve analysis for the thresholds of sTILs to predict pCR in neoadjuvant treated HER2-positive breast cancers. Black dots indicate the different thresholds of sTILs. The optimal threshold, sensitivity, specificity, p value, and area under the curve (AUC) are shown

