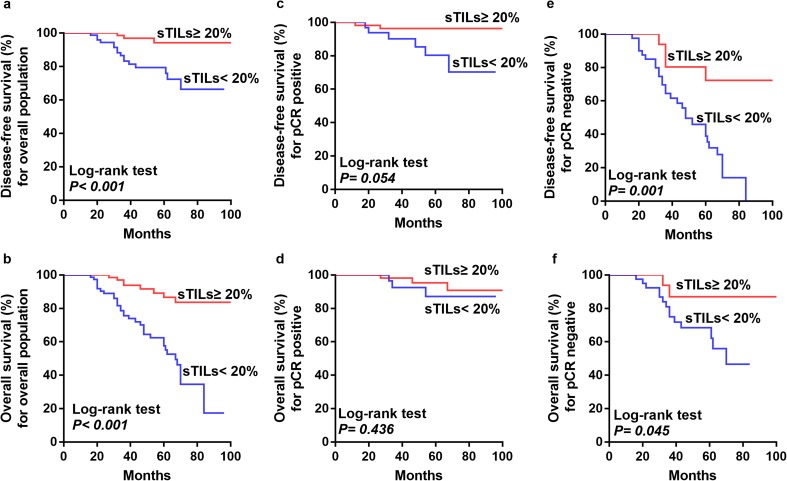
Fig. 4.
Kaplan–Meier curves depicting associations of sTILs with disease-free survival (DFS) and overall survival (OS) in HER2-positive breast cancers. a, b Comparison of DFS (a) and OS (b) between patients with ≥ 20% sTILs and patients with < 20% sTILs in the entire population). c, d DFS (c) and OS (d) between patients with ≥ 20% sTILs and patients with < 20% sTILs in the pCR subgroup. e, f DFS (e) and OS (f) between patients with ≥ 20% sTILs and patients with < 20% sTILs in the non-pCR subgroup. Log-rank p values are shown

