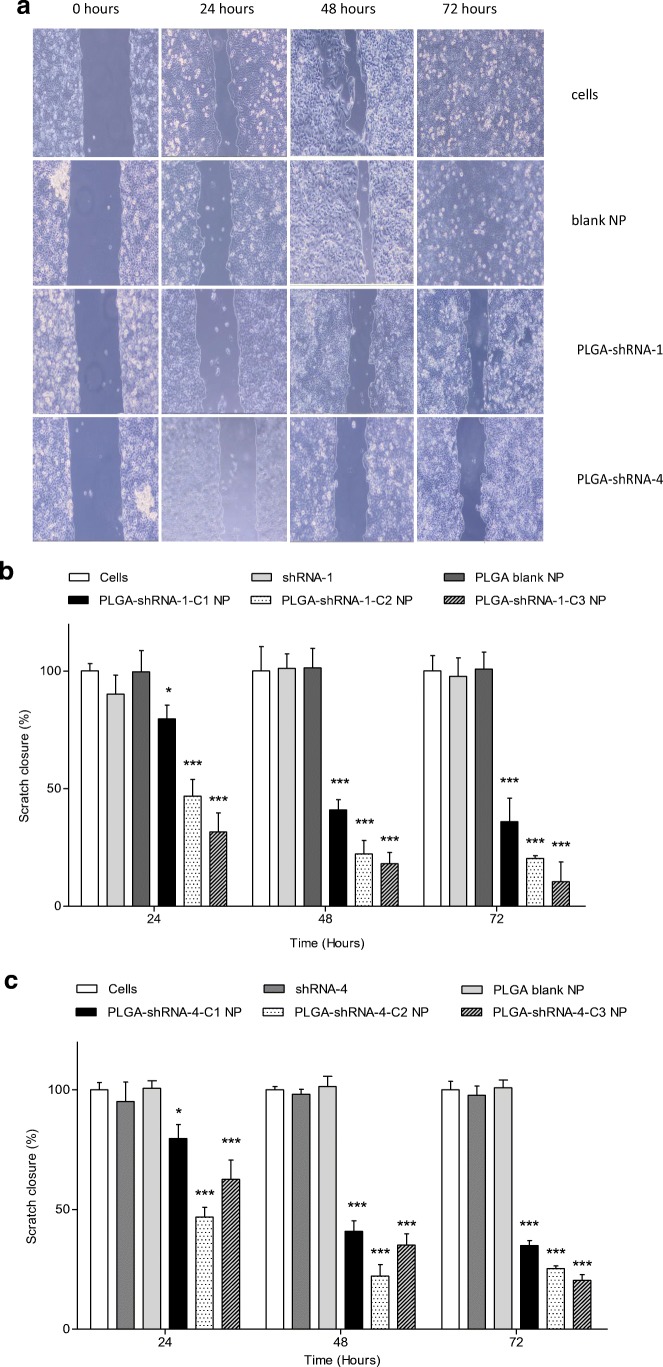
Fig. 4.
Scratch assay performed on confluent MDA-MB231 cells showing (A) light microscopy examination of the effect of PLGA-shRNA-1-NP and PLGA-shRNA-4-NP at 2.0 μg ml−1 on cell migration and (B) graphical representation of the dimensional change over 72 h using PLGA-shRNA-1-NP at three different concentrations and (C) graphical representation of the dimensional change over 72 h using PLGA-shRNA-4-NP at three different concentrations). Data are mean ± SD with n = 6. *P < 0.05, **P < 0.01, ***P < 0.001, C1, C2 and C3 are 0.5 μg ml−1, 1.0 μg ml−1 and 2.0 μg ml−1 of entrapped shRNA-4

