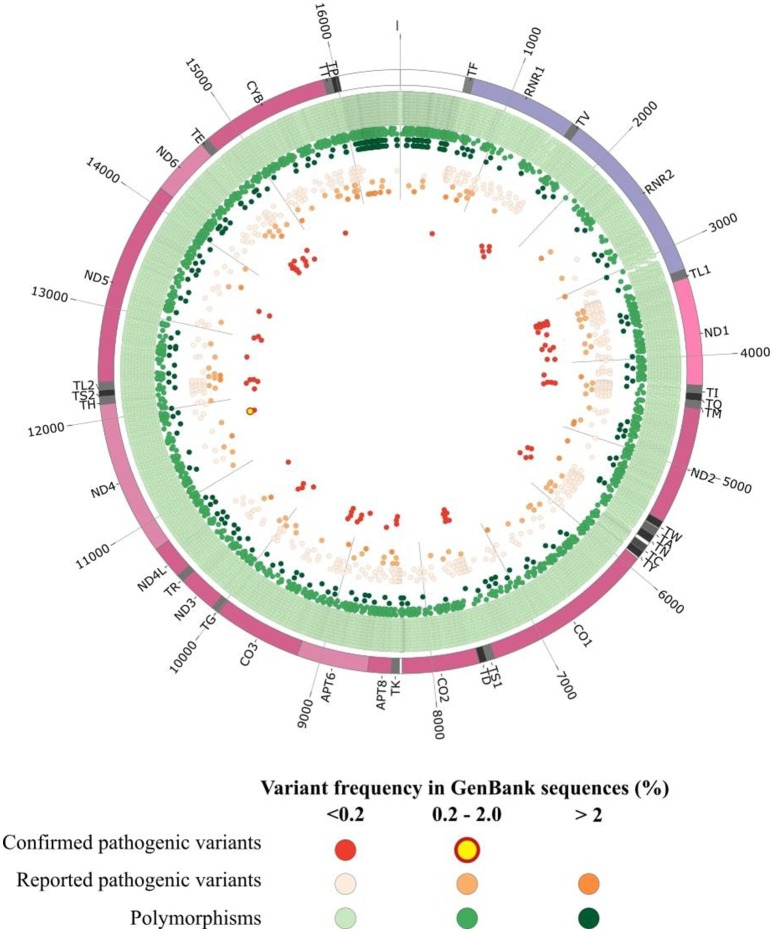
Figure 1.
Graphical representation of human mitochondrial DNA variations. The outer circle depicts the mitochondrial genome with annotated tRNAs (gray), rRNAs (purple), protein-coding genes (Bentley et al., 2008), and non-coding regions (white). In the inner circles each point represent an mtDNA variant reported in GenBank sequences collected from Mitomap according to the variant status reported in Mitomap (polymorphisms in green, reported pathogenic variants in orange, confirmed pathogenic variants in red) and variant frequency in GenBank (< 0.2%, light color; 0.2–2.0%, medium color; >2.0%, dark color).

