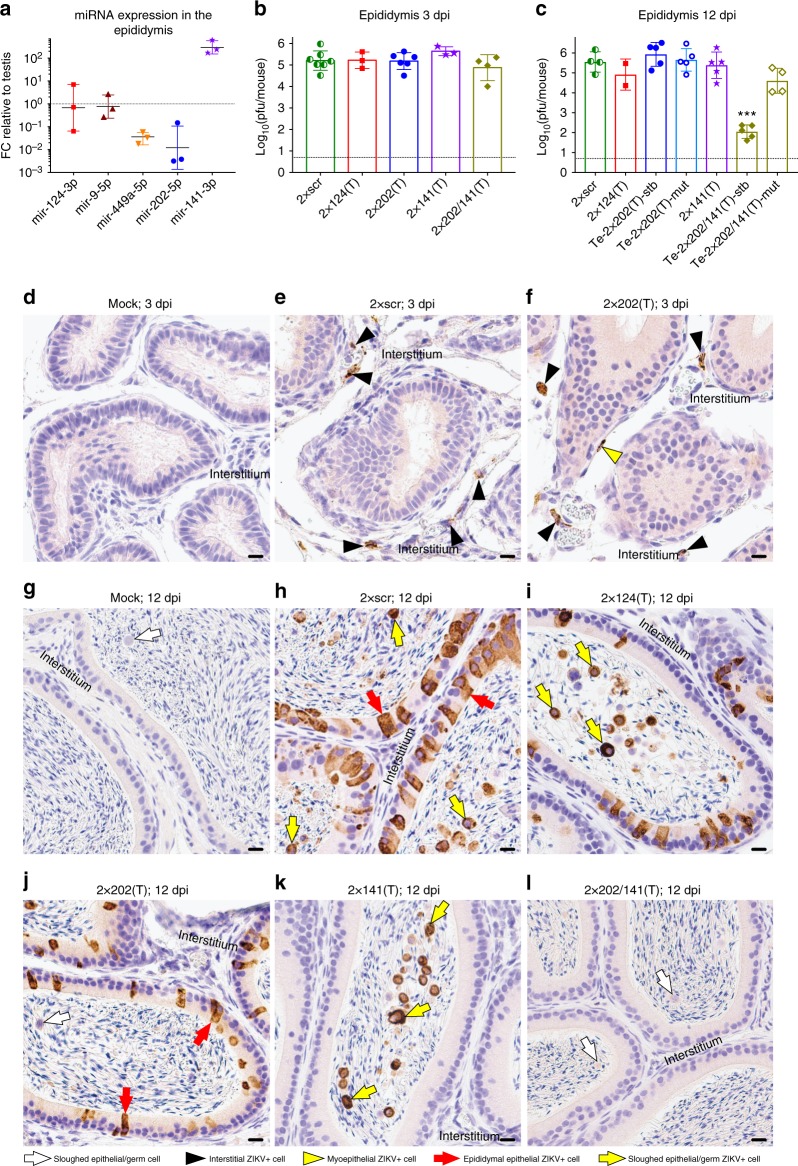
Fig. 4.
Replication of the miRNA-targeted ZIKVs in the epididymis of AG129 mice. a Relative expression of selected miRNAs in the mouse epididymis compared with their expression in the testis. Data show the ratio (FC) of normalized counts for miRNAs isolated from the epididymis to those isolated from the testis of AG129 mice (n = 3). Horizontal lines and error bars are geometric means and geometric SDs, respectively. b–k AG129 mice were infected ip with 106 pfu of 2×scr or miRNA-targeted viruses and were killed at 3 or 12 dpi. b and c Mean viral titers ± SD (shown as error bars) in the epididymis of mice at 3 dpi b and 12 dpi c. Epididymides dissected from mice infected with 2×202(T) or 2×202/141(T) at 12 dpi were divided into two groups based on the miRNA target sequence stability (see Fig. 2 for details). The dashed line indicates the limit of virus detection (0.7 log10(pfu/epididymis)). Differences between the titers of 2×scr and each of miRNA-targeted viruses in the epididymis were compared using one-way ANOVA (***p < 0.001). d–l Representative images of ZIKV antigen distribution in the epididymides of mice that were mock-inoculated or infected with indicated viruses are shown on the indicated dpi (2–6 mice per group). The epididymal interstitium is indicated. Labeling used within panels is indicated at the bottom of the figure. Scale bars: 10 µm

