Fig. 1.
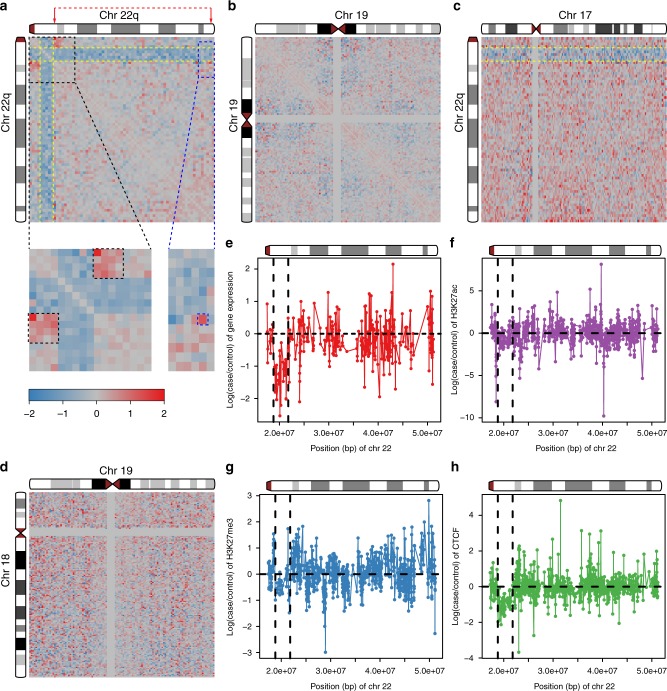
Effects of the 22q11.2 deletion on chromosome interactions, gene expression and chromatin marks. a–d Each pixel in the heatmaps represents the intra- or inter-chromosomal contact frequency in Hi-C data from 22q11.2del cell lines (n = 5) versus control cell lines (n = 6) for a 500-kbp region. Yellow dashed lines indicate the 3-Mbp deletion on chromosome 22q. The color scale goes from −2 (blue) to 0 (gray) to 2 (red). a Fold change of cis-contacts along chromosome 22 in 22q11.2del versus control cell lines. Black boxes indicate increased contacts between the deletion-flanking regions in 22q11.2del cell lines. Blue box: the signal for increased contacts between the centromere–distal deletion-flanking region and the telomeric end of chromosome 22q (red arrows and dashed red line indicate the corresponding chromosome folding event). b Lack of intra-chromosomal fold change of contacts for chromosome 19. c Fold change of inter-chromosomal contacts between chromosome 22 and chromosome 17. d Lack of inter-chromosomal fold change of contacts between chromosome 18 and chromosome 19. e Log2-transformed fold change of gene expression for genes on chromosome 22q in RNA-Seq data from 22q11.2del (n = 5) versus control (n = 9) cell lines. Each point represents a gene. f–h Log2-transformed fold change in ChIP-Seq signals in 22q11.2del versus control cell lines. f H3K27ac histone modifications (n = 5 for 22a11.2del and n = 4 for control cell lines). g H3K27me3 histone modifications (n = 5 for 22a11.2del and n = 4 for control cell lines). h CTCF-binding sites (n = 4 for 22a11.2del and n = 3 for control cell lines). Black vertical dashed lines indicate the 3-Mbp deletion on chromosome 22q in e–h

