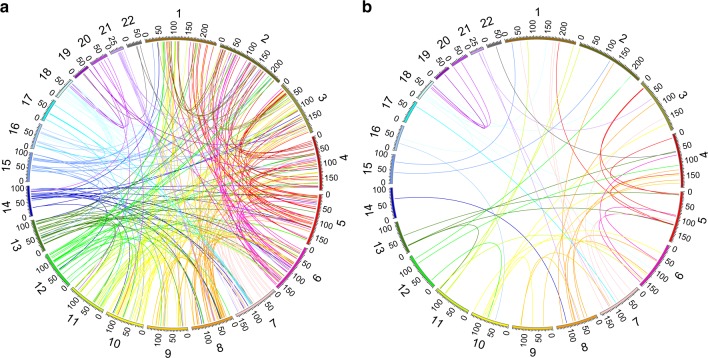
Fig. 6.
Genome-wide inter-chromosomal contact changes in 22q11.2del versus control cell lines. a Circos plot of the inter-chromosomal contacts exhibiting differential interaction in 22q11.2del (n = 5) versus control (n = 6) cell lines at significance level of Student’s t test p value = 0.0001. b Circos plot of the inter-chromosomal contacts exhibiting differential interaction in 22q11.2del (n = 5) versus control (n = 6) cell lines at significance level of Student’s t test p value = 0.0001 and showing only the top 5% strongest inter-chromosomal contacts. The circle displays all autosome-sized scaffolds and each line represents an inter-chromosomal contact change in a, b

