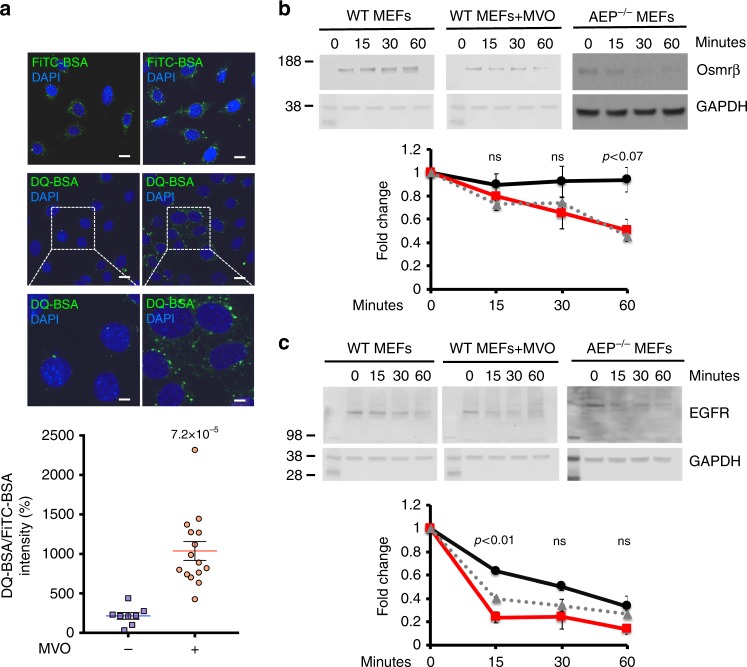
Fig. 3.
Increased lysosomal proteolytic capacity induced by suppression of AEP activity. a FiTC-BSA uptake and DQ-BSA degradation rates in WT 3T3s treated (red circles) or untreated (blue squares) with 50 μM MVO26630 for 16 h. Data are means ± SEM of n = 8 microscopic fields for untreated and n = 15 microscopic fields for MVO-treated. (Scale bar = 20 μm). b Time course of degradation of oncostatin M receptor beta (Osmrβ) in WT MEFs treated (dashed grey line) or untreated (black solid line) with 50 μM MVO26630 for 16 h and AEP−/− MEFs (red solid line) following receptor downregulation by oncostatin M. Relative intensity of each Osmrβ band was calculated for three independent experiments. c Time course of degradation of epithelial growth factor receptor (EGFR) in WT MEFs treated (dashed grey line) or untreated (black solid line) with 50 μM MVO26630 for 16 h and AEP−/− MEFs (red solid line) following receptor downregulation by epithelial growth factor. Relative intensity of each EGFR band was calculated for three independent experiments. Statistical significance was calculated using a two-sided unpaired t-test. ns = not significant

