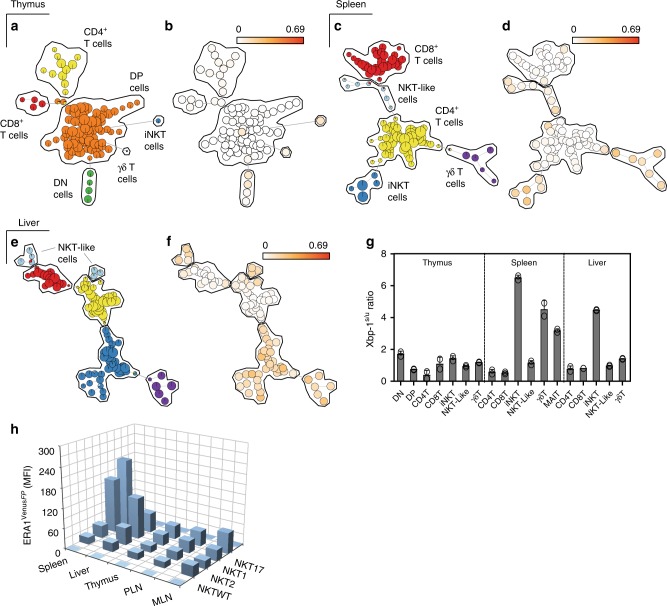
Fig. 1.
Constitutive IRE1α RNase activity in iNKT cells of naïve ERA1- mice. a−f Minimal spanning tree visualization of T-cell subsets by FlowSOM analysis. Manual gating results for a thymus, b spleen and c liver indicate which nodes correspond to the indicated T-cell subsets. Node size corresponds to the percentage of cells represented by each node. b, d, f VenusFP expression within ERA1FP/WT and control ERA1WT/WT mice for thymus, spleen, and liver, respectively (n = 3). Data represent three independent experiments. g Xbp-1s/u mRNA ratio expressed by T-cell subsets isolated from thymus, spleen, and liver of C57Bl/6 mice (n = 5). Bar chart represents two independent experiments pooled. h VenusFP MFI within NKT1, 2 and 17 cells isolated from thymus, spleen, PLN, MLN, and liver of ERA1FP/WT mice (n = 3). iNKTWT represents VenusFP MFI within control iNKT cells isolated from WT mice. Bar chart represents one of three independent experiments. T lymphocyte subsets in (a−g) are defined in Materials and Methods. Error bars show the mean ± s.e.m

