Fig. 2.
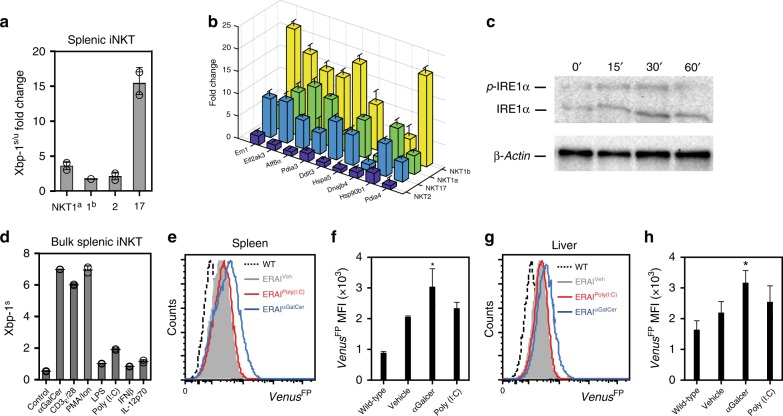
TCR-dependent stimuli regulate activation of UPR in NKT sublineages. Expanded splenic NKT cell sublineages were restimulated with anti-CD3/CD28 (3 μg.ml−1/5 μg.ml−1) for 3 h and fold induction of Xbp-1s/u (a) and ER chaperone mRNAs (b) in stimulated versus resting cells was assessed by qPCR (n = 3). Bar chart represents two independent experiments pooled. c Analysis of phosphorylated IRE1α and total IRE1α in bulk expanded splenic iNKT cells restimulated with α-CD3ε/CD28 for the indicated times via phos-tag immunoblot assay. β-Actin represents the loading control. Results represent one of two independent experiments. d qPCR analysis of XBP1s in expanded splenic iNKT cells stimulated with α-GalCer (100 ng/ml), anti-CD3/CD28 (3 μg.ml−1/5 μg.ml−1), PMA/Ionomycin (1 μΜ/200 ng.ml−1), LPS (20 ng/ml), Poly(I:C) (20 ng/ml), IFNβ (100 U/ml), IL-12p70 (20 ng/ml) or medium (n = 3). Bar chart represents two independent experiments pooled. e−h Control and ERA1FP/WT mice were injected with either vehicle, α-GalCer or Poly(I:C) and iNKT cells were analyzed in spleen and liver 2 h later. Histograms and bar graphs represent VenusFP expression within iNKT cells isolated from the spleen and liver of WT (dashed line, n = 2), vehicle-injected ERA1FP/WT (gray, n = 3), α-GalCer-injected ERA1FP/WT (blue line, n = 3) or Poly(I:C)-injected ERA1FP/WT mice (red line, n = 3) at 2 h postinjection. Histogram and bar chart represents one of three independent experiments. Error bars show the mean ± s.e.m. *p < 0.05 determined by Mann–Whitney U test

