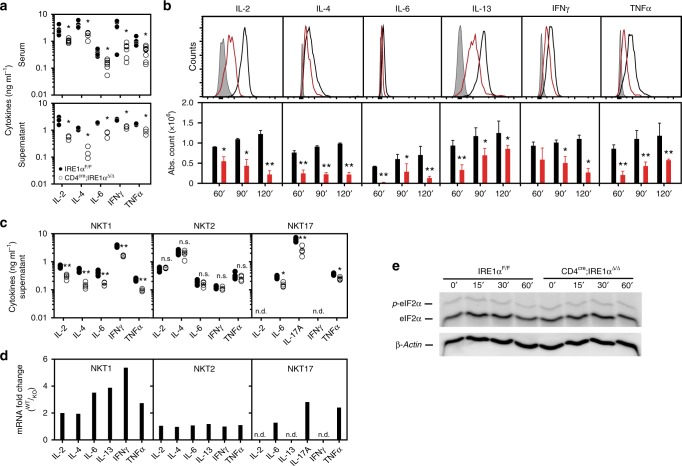
Fig. 3.
Impaired cytokine production by IRE1α-deficient iNKT cells. a Cytokines measured in serum from control (n = 11) and CD4cre;IRE1αΔ/Δ (n = 12) at 4 h post-α-GalCer injection. Dot blots are representative of two independent experiments pooled. (Lower panel) Expanded iNKT splenocytes from control (n = 4) and CD4cre;IRE1αΔ/Δ (n = 4) mice were restimulated with anti-CD3/CD28 for 72 h and cytokines were measured in supernatant by ELISA. b FACS histograms (upper panel) and absolute cell counts (lower panel) of cytokine-positive splenic iNKT cells isolated from control (black line, n = 4) and CD4cre;IRE1αΔ/Δ (red line, n = 4) mice following injection of vehicle (isotype, gray) or α-GalCer at 60, 90, and 120 min postinjection, respectively. Histograms and bar charts are representative of two independent experiments. Supernatant cytokines (c) and cytokine mRNAs (d) from splenic NKT sublineages isolated from control (n = 4) and CD4cre;IRE1αΔ/Δ (n = 4) mice following restimulation with anti-CD3/CD28 for 3 h. qPCR data are represented as fold mRNA change in control versus knock-out (KO) cells. Dot blot and bar chart represents two independent experiments pooled. Phos-tag immunoblot analysis of eIF2α and phosphorylated-eIF2α (e) in bulk expanded splenic iNKT cells isolated from control (n = 4) and CD4cre;IRE1αΔ/Δ (n = 4) mice following restimulation with anti-CD3/CD28 at indicated time points. β-Actin represents the loading control. Results are representative of two independent experiments. Error bars show the mean ± s.e.m. *p < 0.05, **p < 0.01 determined by Mann–Whitney U test and unpaired t test; n.d. not detected; n.s. not significant

