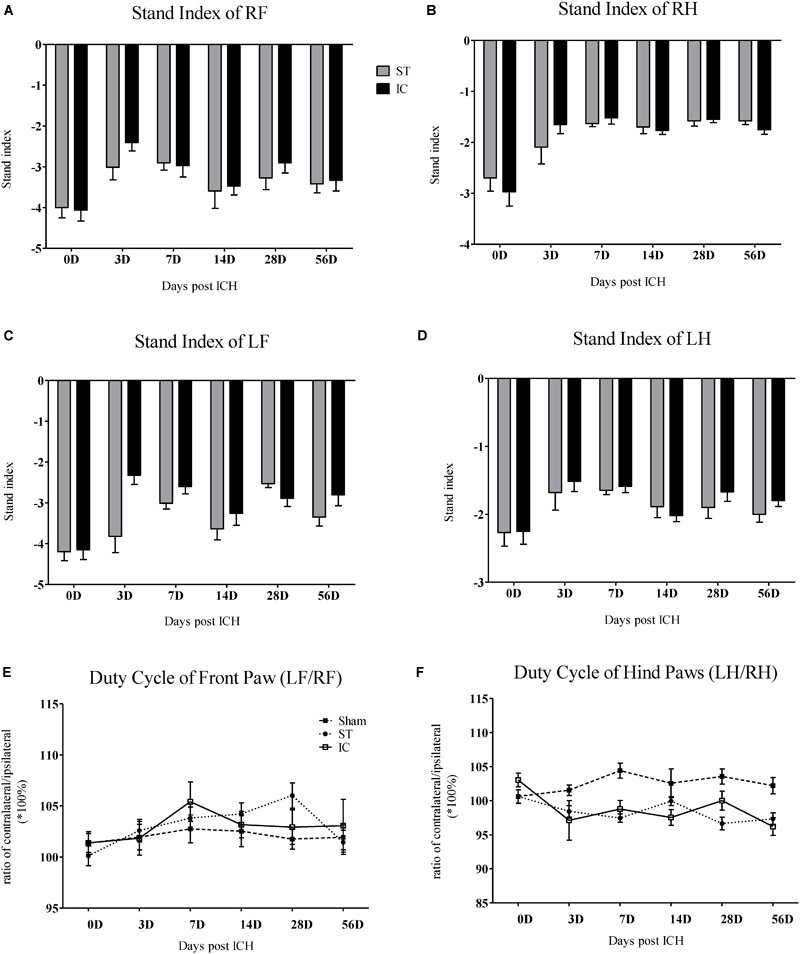
FIGURE 4.

Stand index and duty cycle of IC model over 2 months. The time course changes in the stand index in four limbs (A–D) of two ICH models (n = 10 in each group). The time course changes in duty cycle in front limbs (E) and hind limbs (F) of two ICH models (n = 10 in each group). Data are shown as mean ± SEM.
