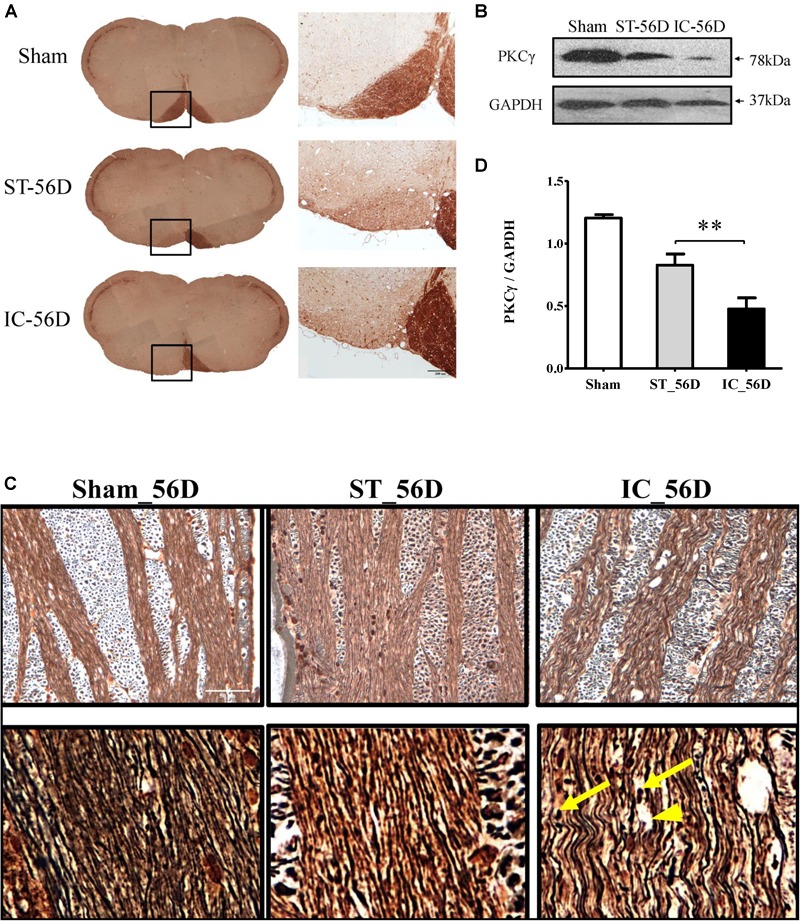
FIGURE 7.

(A) Representative immunohistochemistry of PKCγ in medullary CST of IC group and ST group demonstrating significant axonal loss in the ipsilateral pyramid white matter tracts on day 56. (B) Quantification of PKCγ levels in CST of three groups on day 56 from western blot, represented as the optical density. (C) A significant reduction of PKCγ expression levels in rats with IC at 56 days compared to ST groups (n = 6 in each group). Data are shown as mean ± SEM. ∗∗∗p < 0.001, ∗∗p < 0.01, ∗p < 0.05. ∗IC group was compared with ST group. Scale bar = 200 μm. (D) Comparison of Bielschowsky sliver staining of the descending CST in ST and IC rats at 56 days after onset. Photomicrographs from the longitudinal sections showed axonal retraction bulbs (yellow arrows) with dilated myelin sheaths and enlarged tubular space (arrowhead) in IC group rather than ST group on day 56 after ICH. Scale bar = 50 μm.
