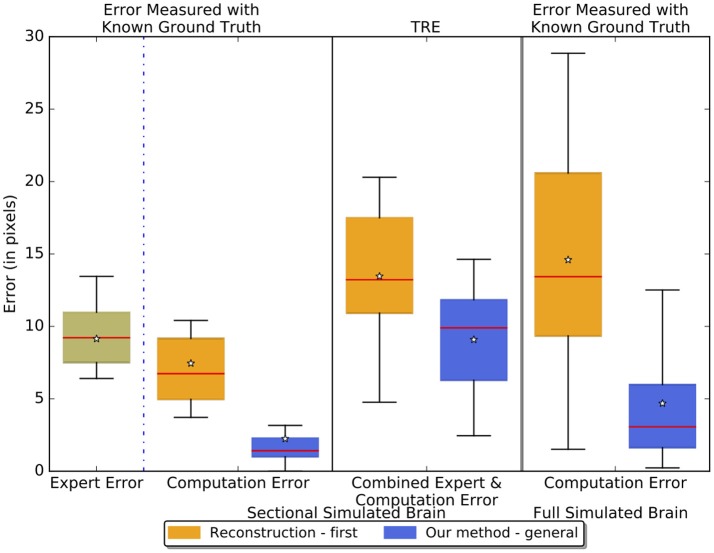
Figure 7.
Boxplots showing the experiment results on the sectional simulated brain and the full simulated brain. The boxplots in the left two columns show the sectional brain results. We measured the intrinsic expert error, pure computation error, and the TRE - combined expert error and computation error of the reconstruction-first method and our method. The third column shows the results on the full simulated brain where we measured the pure computation error. The lines on the boxes represent the minimum, first quartile, median (red), third quartile, and maximum respectively. The star denotes the average.

