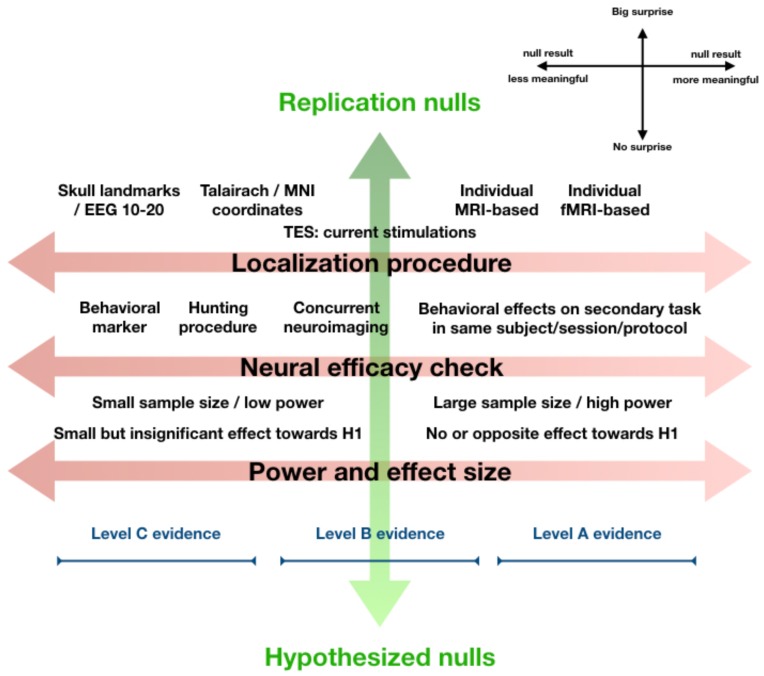
FIGURE 1.
Orthogonal gradients of surprise and interpretability. A null result in an experiment aiming to replicate a well-established finding is very surprising. A null result that was hypothesized is not at all surprising. A null result in an exploratory study with no prior expectations can be received neutrally (middle of the continuum, not shown). The level of surprise (vertical axis) essentially reflects how a null finding relates to our prior expectations. From a Bayesian perspective, even without Bayesian statistics, we should let this level of surprise (if justified based on theory or previous research) influence to what extent we let the result “change our beliefs.” This explicitly refers to interpretation of a null result in the greater context of knowledge, theory, and prior research. Orthogonal to this, one might evaluate the experiment and its parameters in terms of localization procedure, neural efficacy checks, and power and effect size, together making up a gradient of interpretability (horizontal axis). This continuum reflects how informative we should consider the null result in isolation, ignoring expectations, theory, or previous research. The figure displays our view on how design choices impact the interpretability of a null finding along this dimension (toward the right is more informative, see legend top-right). At the bottom, we schematically visualize how the collective of such “leftward” design choices can place a null result into the “Level C evidence category,” which means the null result in isolation is not very informative, while the collective of such “rightward” design choices can place a null result in the highest “Level A evidence” category, which means a null result appears informative and should be taken seriously. A few caveats are important. This figure aims to visualize concepts discussed in more detail in main text, and how they relate to each other. The visualization of Level C through Level A evidence is meant to make intuitive how they roughly fit into this overview, our proposal for what exactly differentiates Level A through C evidence is in main text. Lastly, we do not suggest that every design decision “on the right” in this figure is always best for every experiment, or that experiments yielding Level C evidence are somehow inferior. Note also that the figure reflects how design factors influence how informative null findings are, it does not apply to positive findings in a straightforward way.

