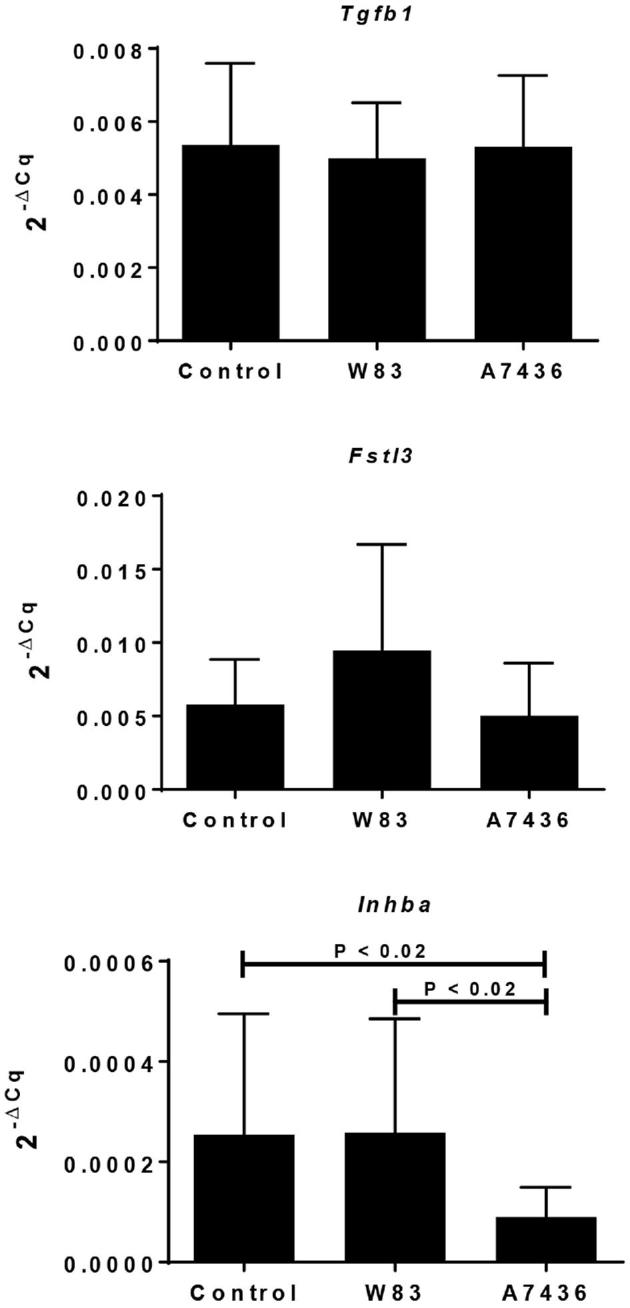
Figure 4.

Gene expression of TGFB1 superfamily members in the metrial triangle of sham control and dams chronically infected with Pg. Values reflect the mean 2–ΔCq ± SD relative gene expression of 12 biological replicates obtained from two independent experiments. The corresponding Actb Cq was used as the reference gene for each sample. Data were analyzed by Kruskall–Wallis followed by Dunn multiple comparison's test.
