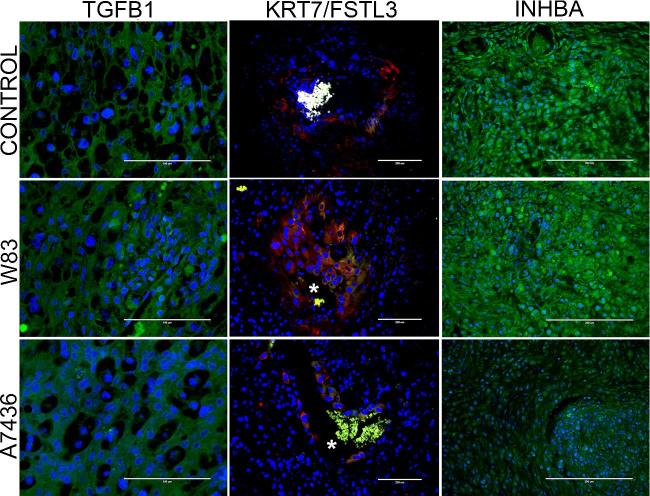
Figure 5.
Representative images of TGFB1 (green), cytokeratin-7 (KRT7, red)/follistatin-related protein 3 (FSTL3, green), and inhibin beta A (green) staining in the mesometrial triangle of control, W83, and A7436 groups. “*” indicates the presence of autofluorescent red blood cells within the vessel lumen. Scale bar in stained sections is equal to 100 μm (TGFB1) or 200 μm (KRT7/FSTL3, INHBA).

