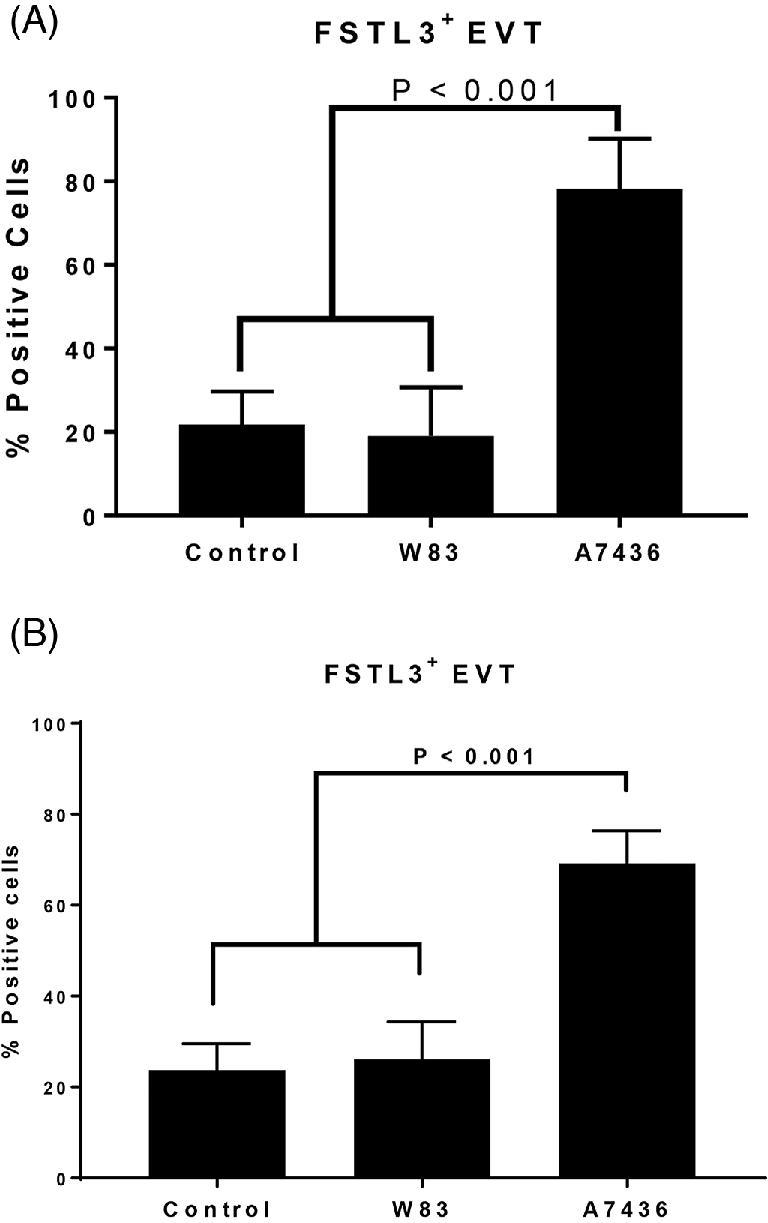
Figure 6.

The percentage of FSLT3-positive EVT in the mesometrial arterioles of control, and Pg-antigen positive groups from the acute (A) and chronic (B) cohorts. Values in each graph represent the mean ± SD of five biological replicates from two independent experiments. Data were analyzed by one-way ANOVA and Tukey test.
