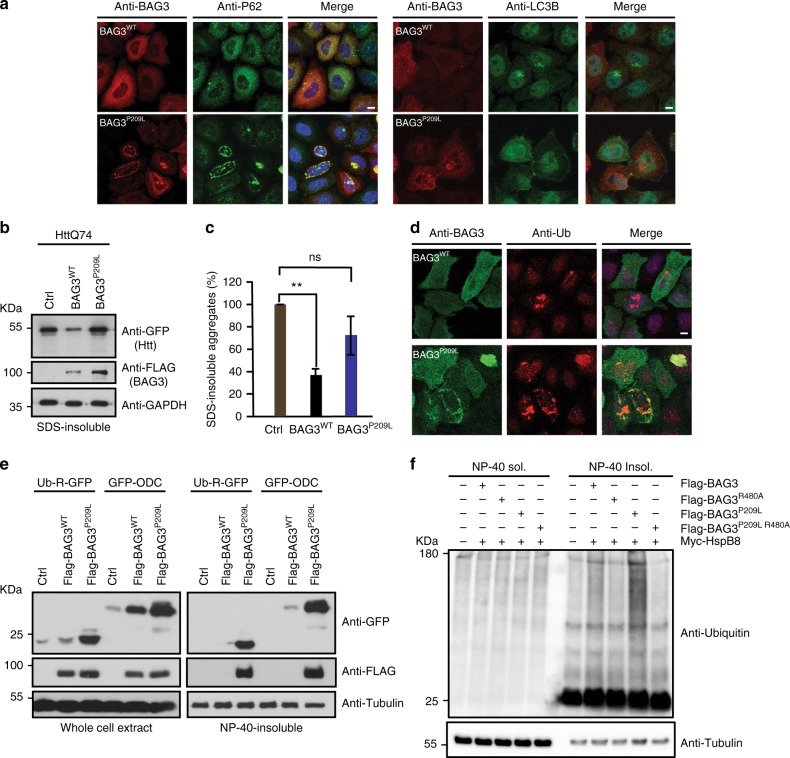
Fig. 6.
BAG3P209L aggregation leads to co-aggregation of proteasomal substrates. a Immunofluorescence pictures of HeLa cells expressing FLAG-BAG3WT or FLAG-BAG3P209L using antibodies against BAG3 (green) or ubiquitin (red). Scale bar = 5 μm. b Suppression of GFP-HttQ74 aggregation of cells expressing a control, FLAG-BAG3WT or FLAG-BAG3P209L. Western blot against indicated antibodies is shown. c Quantification of GFP-HttQ74 aggregation of experiments similar to b. Relative percentage of SDS-insoluble protein levels are shown. Data represents the mean and standard deviation of three independent experiments. d Immunofluorescence pictures of HeLa cells expressing FLAG-BAG3WT or FLAG-BAG3P209L using antibodies against BAG3 (green) or ubiquitin (red). Left column BAG3, middle column ubiquitin and right column is the merge of BAG3 (green), ubiquitin (red), and DAPI (blue). Scale bar = 5 μm. e Fractionation of HEK293 cells expressing HSPB8, a control or BAG3WT or BAG3P209L, together with either Ub-R-GFP or GFP-ODC (ornithine decarboxylase). Western blot against GFP, FLAG (BAG3), Myc (HSPB8), and tubulin are shown. f Fractionation of HEK293 cells expressing HSPB8 and indicated BAG3 variants. Western blot using ubiquitin (FK2) and tubulin antibodies are shown. The same samples as in Fig. 5e have been used, loading control is therefore the same. Source data are provided as a Source data file

