Fig. 9.
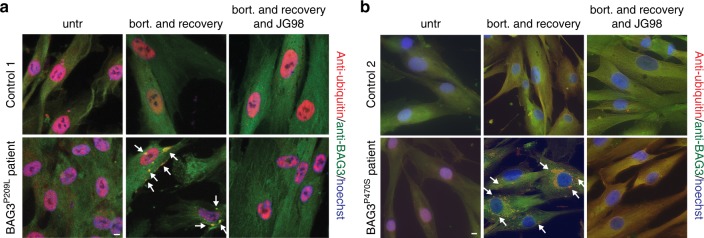
Abrogation of BAG3–Hsp70 by pharmaceutical intervention. a, b Immunofluorescence pictures using BAG3 (green) and ubiquitin (FK2; red) antibodies of primary control versus BAG3P209L patient fibroblasts (a) or primary control versus BAG3P470S patient fibroblasts (b). Cells were either untreated, treated for 6 h with bortezomib followed by a 20 h recovery or treated for 6 h with bortezomib followed by a 20 h recovery in the presence of 0.05 µM JG98. Arrows indicate BAG3-punctae. Scale bar = 5 μm. Source data are provided as a Source data file

