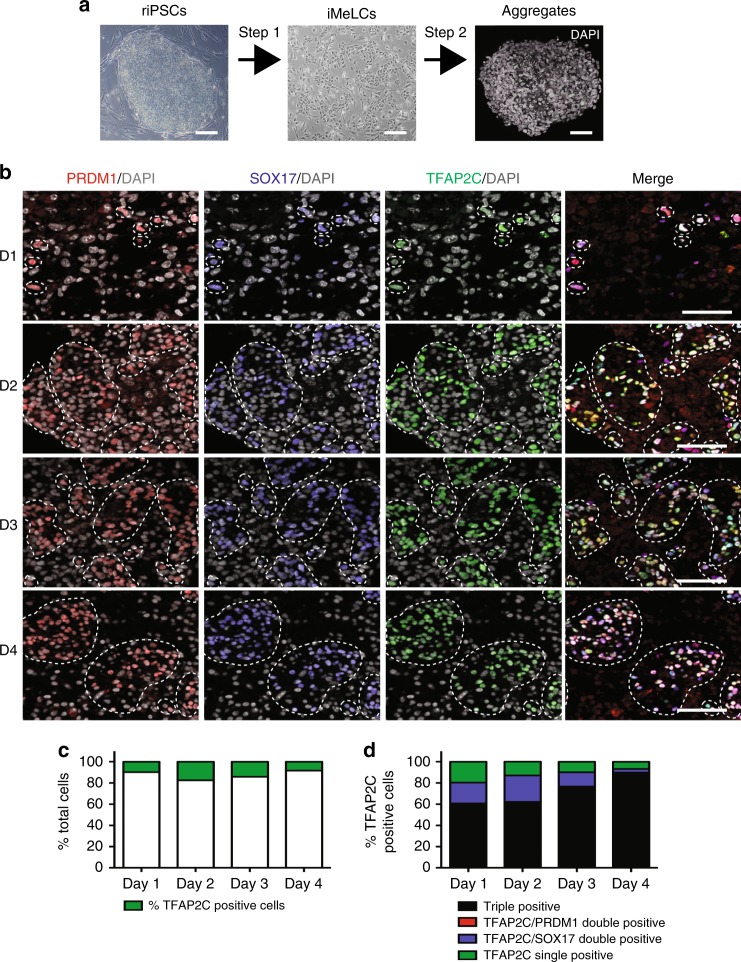
Fig. 2.
Specification of rPGCLCs from riPSCs. a Schematic overview of rPGCLC-specification in aggregates via an iMeLC intermediate. Scale bars = 100 µm, shown are images of riPSC89 differentiation. b Triple IF staining for germ cell markers during riPSC89 aggregate differentiation from Day (D) D1 through D4. PRDM1 (red), SOX17 (blue), TFAP2C (green), DAPI (gray). Dotted lines highlight TFAP2C positive cells (single and clusters). Scale bars, 50 µm. N = 3 biological replicates. c The percent of TFAP2C positive cells (green) in aggregates at D1–D4. d The percent of TFAP2C positive cells in aggregates at D1–D4 that are either single (TFAP2C, green), double (TFAP2C/PRDM1, red or TFAP2C/SOX17, blue), or triple (TFAP2C/PRDM1/SOX17, black) positive for early rPGC markers. Shown are results using the riPSC90 cell line, unless otherwise stated

