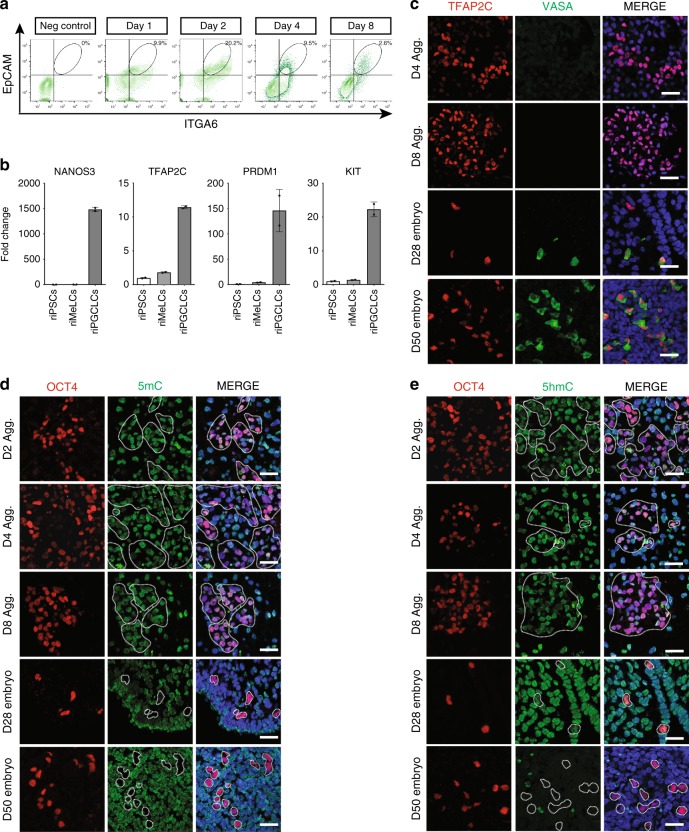
Fig. 3.
rPGCLCs in aggregates correspond to early rPGCs prior to global 5mC erasure. a FACS plots showing the percent of EPCAM/ITGA6 double positive cells in undifferentiated riPSC89 (neg control), and riPSC89 aggregates at Day (D) 1, 2, 4, and 8. b RT-PCR analysis show enrichment of early rPGC markers in rPGCLCs (riPSC89) isolated by FACS at D6 using EPCAM/ITGA6. All data points used to generate the bar graphs (black circles) were overlaid to the corresponding bar graphs, error bars represent the Standard Error of the Mean (S.E.M.). c IF staining of rPGCLCs/rPGCs identified with TFAP2C (red) indicate that the late-stage rPGC marker VASA (green) is not expressed in rPGCLCs at D4 or D8 and instead is expressed in rPGCs in CS12 (D28) and CS23 (D50). Scale bars, 20 µm. d IF staining showing 5mC (green) is present in OCT4-positive(+) (red) rPGCLCs in aggregates (dotted white line) at D2, D4, and D8, while being absent from OCT4+ (red) rPGCs (dotted white line) in CS12 (D28) and CS23 (D50) embryos. Scale bars, 20 µm. e IF staining of 5hmC (green) in OCT4+ (red) rPGCs (dotted white line) at CS12 (D28) as well as in OCT4+ (red) rPGCLCs (dotted white line) in D2, D4, and D8 aggregates. CS23 (D50) rPGCs (OCT4+, red) do not have detectable 5hmC (green). Scale bars, 20 µm. Shown are results using riPSC90 unless otherwise stated. N = 3 biological replicates for riPSCs and CS12 (D28); n = 2 biological replicates for CS23 (D50)

