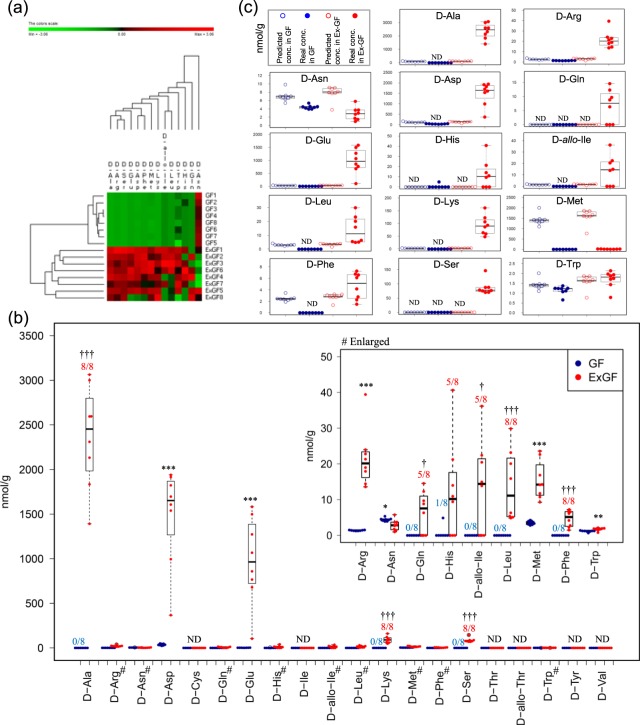
Figure 1.
Difference in the colonic luminal D-amino acids between GF mice and Ex-GF mice. (a) Hierarchical clustering showing patterns of D-amino acids. Red and green indicate high and low concentrations of metabolites, respectively. (b) Concentrations of D-amino acids. Numbers above bars indicate incidences. *Significant difference between groups in the concentration (*p < 0.05, **p < 0.01, ***p < 0.001) by the Mann–Whitney U-test. †Significant difference between groups in the incident (†p < 0.05, †††p < 0.001) by Fisher’s extract test. #These metabolites graphs are enlarged. (c) Quantitative comparison of D-amino acids between actual concentration in colonic content and estimated concentration when pellets reached the colon in GF mice and Ex-GF mice (nmol/g of feces). Estimated values of pellet D-amino acids in the colonic lumen were calculated as follows: estimated values of D-amino acids (nmol/g) = measured concentration in pellet/[pellet solid content (%)/solid content of colonic content (%)].

