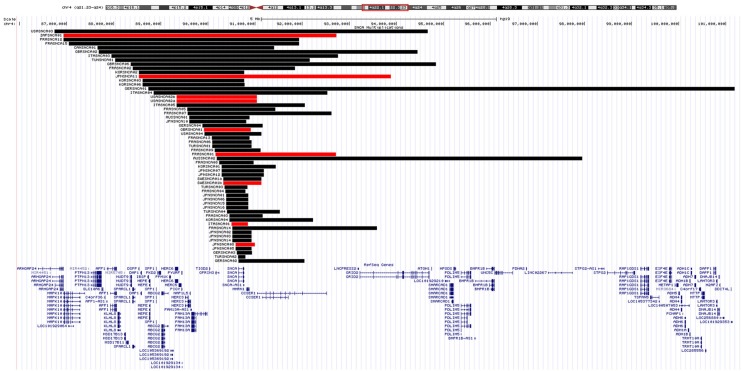
Figure 3.
SNCA genomic multiplications. A UCSC Genome Browser (http://genome.ucsc.edu/; hg19) view of the chromosomal region 4q21-14 is shown, together with Refseq genes. SNCA multiplications identified by MEGA CNV analysis are displayed as a custom track in USCS. The horizontal black/red bars represent the SNCA CNV3/4 in each proband. BELSNCA02 SNCA duplication (41.4 Mb) is not shown for scaling reasons.

