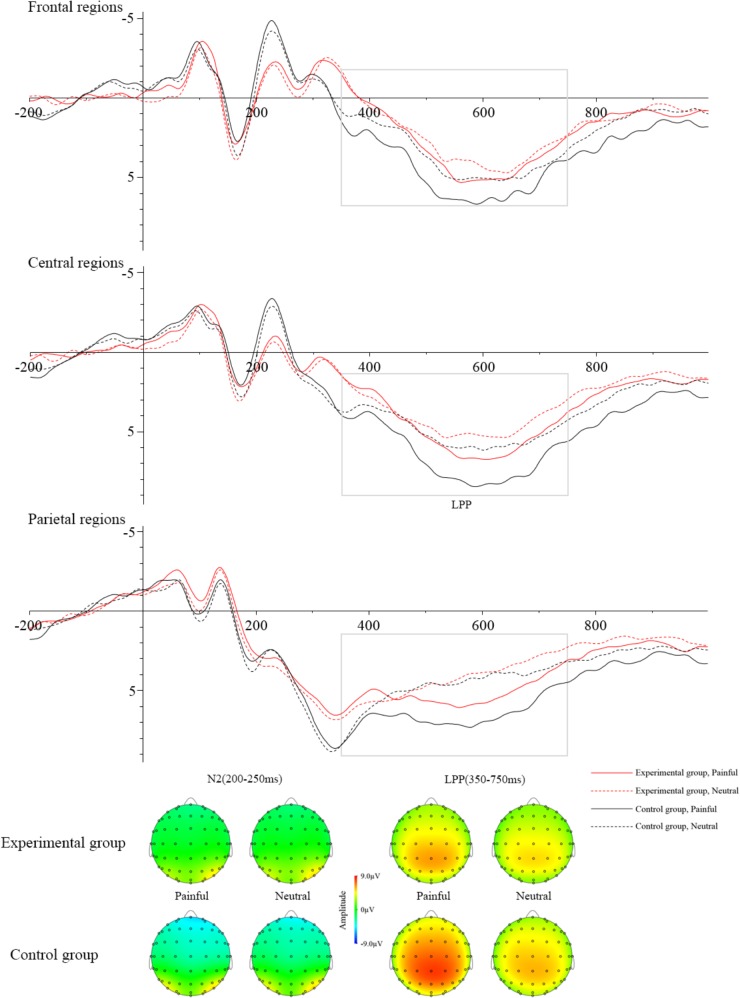
FIGURE 2.
Grand averages of ERPs at Frontal regions, Central regions, and Parietal regions when watching painful pictures in the control group (black solid line), painful pictures in the experimental group (red solid line), neutral pictures in the control group (black dotted line), and neutral pictures in the experimental group (red dotted line). The voltage topographies illustrate the scalp distribution of N2 and LPP components.

