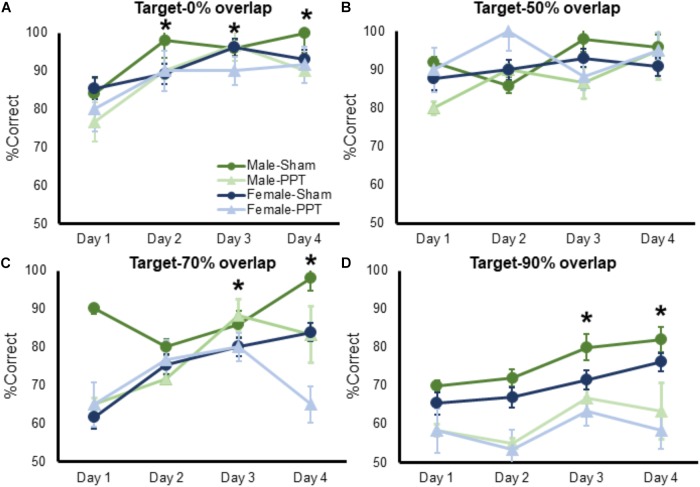
FIGURE 4.
Performance on target-lure discriminations as a function of test day. In all panels mean percent corret is shown on the Y-axis and test day is represented on the X-axis. (A) Performance on 0% lure trials significantly improved as a function of test day (F[1,26] = 11.73, p = 0.002), which did not interact with sex (F[1,26] = 0.56, p = 0.65) or experimental group (F[1,26] = 0.18, p = 0.91). (B) Performance on 50% lure trials did not significantly improve as a function of test day (Figure 4B; F[1,26] = 2.16, p = 0.10), and this did not interact with sex (F[1,26] = 1.35, p = 0.26). The percent of correct trials over testing days did, however, significantly interact with experimental group (F[1,26] = 3.11, p = 0.031). Post hoc analysis showed that PPT rats improved significantly between test days 1 and 2 (corrected α = 0.05/3 = 0.017; T[11] = 2.87, p = 0.015), while sham animals did not show a significant improvement across any test day (p > 0.14 for all comparisons), as they may have already been near ceiling performance at day 1. (C) Performance on 70% lure trials significantly improved as a function of test day (F[1,26] = 5.52, p = 0.002), which did not interact with sex (F[1,26] = 2.02, p = 0.12) or experimental group (F[1,26] = 2.27, p = 0.09). (D) Percent of correct responses on 90% lure trials significantly improved as a function of test day (F[1,26] = 3.89, p = 0.012), which did not significantly interact with sex (F[1,26] = 0.14, p = 0.94) or experimental group (F[1,26] = 0.80, p = 0.50). Error bars are ± 1 SEM. ∗Indicates significant effect.

