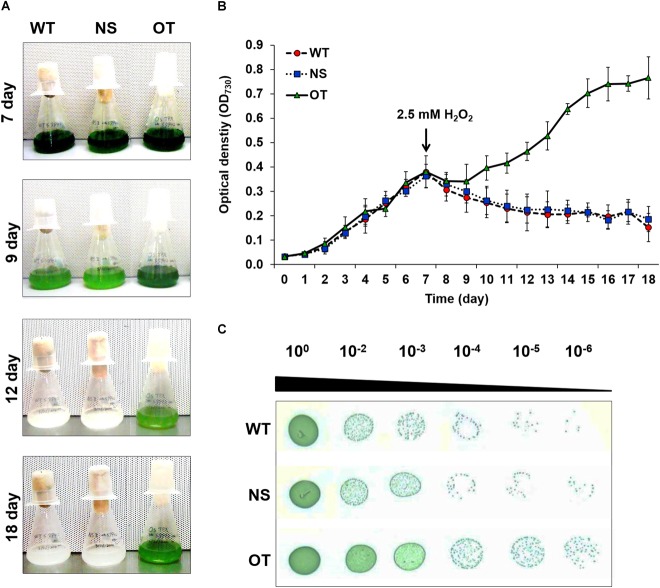
FIGURE 4.
Analysis of WT, NS, and OT strains H2O2 stress tolerance. (A) Phenotypes, (B) growth phase of each strains, and (C) spotting assay and error bars calculated from the SD of three independent experiments. WT, wild-type; NS, empty neutral-site vector strain; OT, overexpression transgenic strain. Error bars indicate ± SD of three independent experiments. Asterisks indicate significant differences between treatments as estimated by Student’s t-test (P < 0.05).

